
When the market is trending, I trade with the trend. But a lot of the time, the higher-timeframe trend is simply sideways. In those conditions, I look for levels where price is likely to react and scalp off them. Two tools I use for that are pivot points and Fibonacci retracements, especially the 50% zone.
Here’s how both work, how to calculate them, and how I use them.
What pivot points are
Pivot points are price levels calculated from the previous session’s high, low and close. Because they’re based on a simple formula and published on almost every platform, a huge number of traders see the same levels. That shared attention is part of why price often reacts near them.
The standard daily calculation:
| Level | Formula |
|---|---|
| Pivot (P) | (High + Low + Close) / 3 |
| Resistance 1 (R1) | (2 x P) – Low |
| Support 1 (S1) | (2 x P) – High |
| Resistance 2 (R2) | P + (High – Low) |
| Support 2 (S2) | P – (High – Low) |
High, Low and Close are from the previous day. For forex, most platforms define the day as ending at 5:00 p.m. New York time, which is also Toronto time.
You can calculate weekly or monthly pivots the same way using the previous week or month. Weekly pivots are useful for swing trades; daily pivots suit intraday trading. Most platforms will draw them for you.
How pivots work in a ranging market
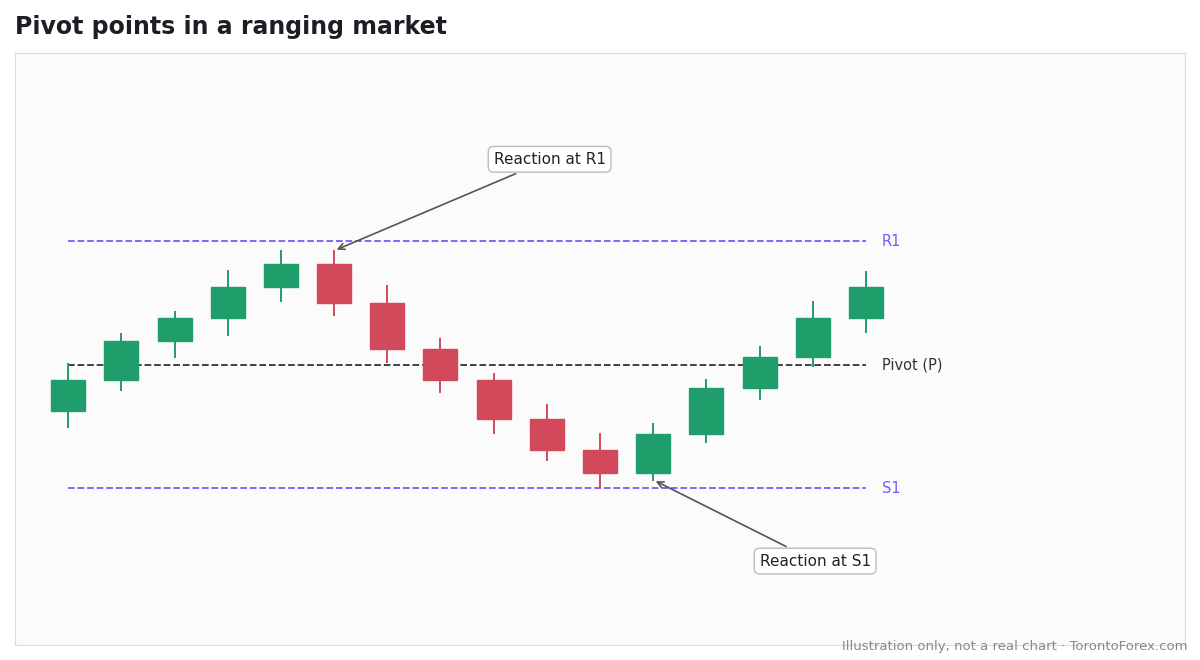
In a range, price often moves between the pivot levels:
- The pivot (P) acts as the day’s balance point. Above it, the bias is slightly bullish; below it, slightly bearish.
- R1 and S1 are the most common reaction points for scalping in a range.
- R2 and S2 are usually only reached on more active days.
In a range, the approach is to sell reactions near R1, buy reactions near S1, and treat the pivot as a target or a decision point. As always, treat the levels as zones, not exact prices; our guide to support and resistance explains why.
One important caution: on a strongly trending day, price can blow straight through every pivot. Pivots work best when the higher timeframe is ranging. Check the structure first; our guide to market structure explains how.
Fibonacci retracements and the 50% zone
Fibonacci retracement levels measure how far price pulls back within a move. You draw from a swing low to a swing high (or the reverse), and the tool marks common retracement levels, typically 23.6%, 38.2%, 50%, 61.8% and 78.6%.
The level I use most for scalping is the 50% zone: price pulling back halfway into the previous move.
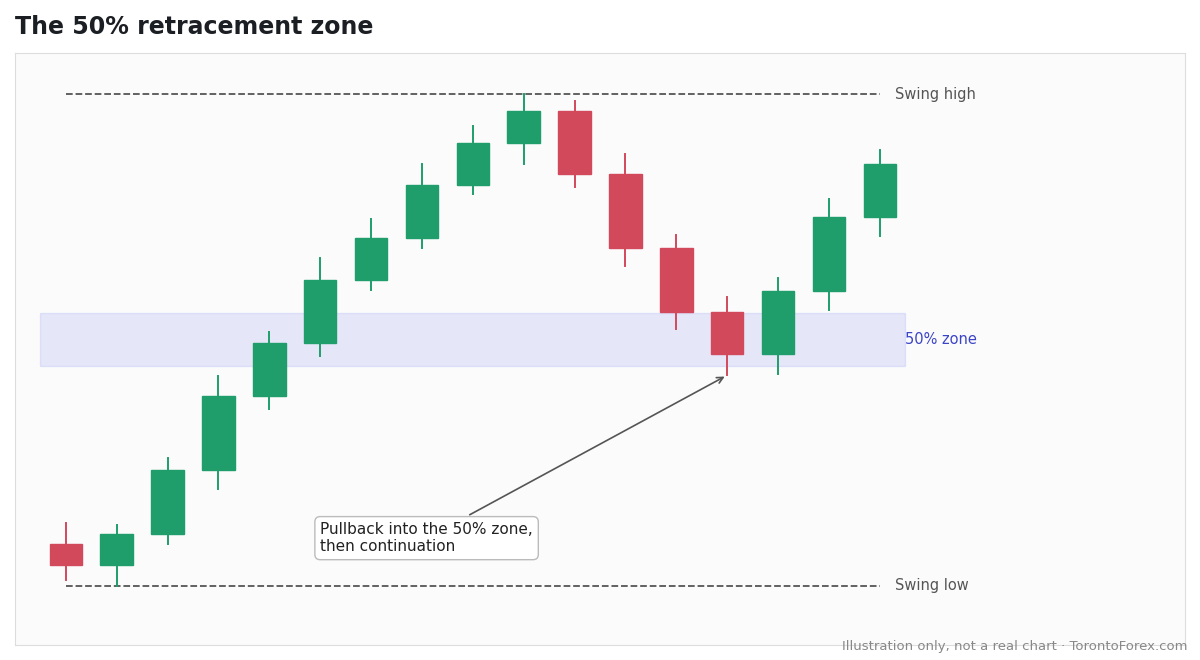
A small but interesting detail: 50% isn’t actually a Fibonacci ratio. It comes from older market theory, the idea that price often retraces about half of a move. But it’s included in almost every Fibonacci tool, and it’s one of the most widely watched levels, which is reason enough to pay attention to it.
The same idea shows up elsewhere. Traders who use fair value gaps watch the 50% level of the gap, as we covered in our fair value gap guide. Halfway points matter because so many people watch them.
How to use the 50% zone for scalping
- Identify a clear swing. The move should be obvious, not a tiny wiggle.
- Draw the retracement from the swing low to the swing high in an up move (or high to low in a down move).
- Mark the 50% level as a zone, not a single line.
- Wait for price to pull back into the zone.
- Look for a reaction: a rejection candle, a small break of structure on a lower timeframe, or a level that lines up with something else.
- Enter with a tight stop beyond the zone, and take quick profits, which is the nature of scalping.
When levels line up
The strongest scalping setups often come when several tools point to the same area. For example:
- The 50% retracement lines up with the daily S1 pivot
- A pivot level sits at a previous support or resistance zone
- The 50% zone overlaps a fair value gap
When two or three independent reasons point to the same price, the reaction tends to be more reliable. When a level stands alone, be more cautious. This planning-and-alerts approach is how I work around a busy day; we cover it in currency trading strategies for Toronto traders.
Common mistakes
- Using pivots in a strong trend. They get run over.
- Drawing Fibonacci on tiny swings. The levels mean little on insignificant moves.
- Expecting exact reactions. Price overshoots; use zones.
- Ignoring the day’s news. A major release can push straight through any level.
- Holding scalps too long. If the reaction doesn’t come quickly, the setup may be wrong.
The bottom line
Pivot points are calculated from the previous day’s high, low and close, and because so many traders watch them, price often reacts near R1, S1 and the pivot itself, especially in sideways markets. The 50% retracement zone, while not technically a Fibonacci ratio, is one of the most-watched pullback levels and a useful area for scalping. Use both as zones, check the bigger trend first, and look for setups where several levels line up.
Disclosure: The author, Mike Harding, founded Academy of Financial Markets in Toronto and teaches its mentorship program. Charts in this article are illustrations, not real market data. This article is educational and is not financial advice. Trading carries a high level of risk.