
“Fair value gap” is one of the most talked-about terms in trading right now. Open any trading video and someone is marking an FVG and waiting for price to return to it. But a lot of that content skips the basics: what a gap actually is, when it matters, and when it doesn’t.
This guide covers the definition, then walks through 12 illustrated examples, from the simplest gap to the trickier cases. At the end, we’ll look at a question I find interesting: why harmonic patterns, which dominated technical trading a decade ago, have almost disappeared from the conversation.
The charts in this article are illustrations, drawn to show each idea clearly. Real charts are messier.
What a fair value gap is
A fair value gap is a three-candle pattern that shows a fast, one-sided move.
- Bullish FVG: the low of the third candle is above the high of the first candle. The middle candle moved up so quickly that the first and third candles don’t overlap. The space between them is the gap.
- Bearish FVG: the high of the third candle is below the low of the first candle. Same idea, downward.
The theory is that the move happened so quickly that one side, buyers or sellers, overwhelmed the other, and price skipped over a range without much two-way trading. Traders who use FVGs watch for price to come back into that range later, sometimes to “fill” it, and look for a reaction there.
An FVG is not a guarantee of anything. It’s an area of interest, like a support or resistance zone, and it works best when it fits the bigger picture.
Example 1: A bullish fair value gap
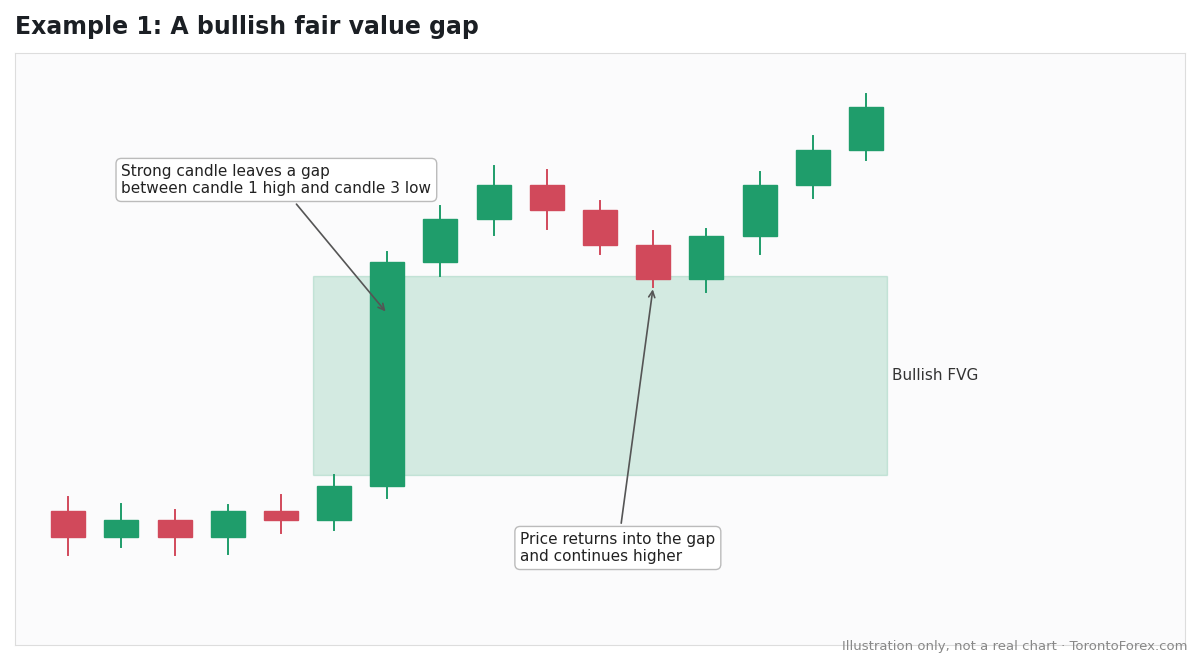
The basic pattern. A strong bullish candle leaves a gap. Price continues higher, then pulls back into the gap and finds buyers again. In an uptrend, that pullback is where FVG traders look for a long entry, with a stop below the gap.
Example 2: A bearish fair value gap
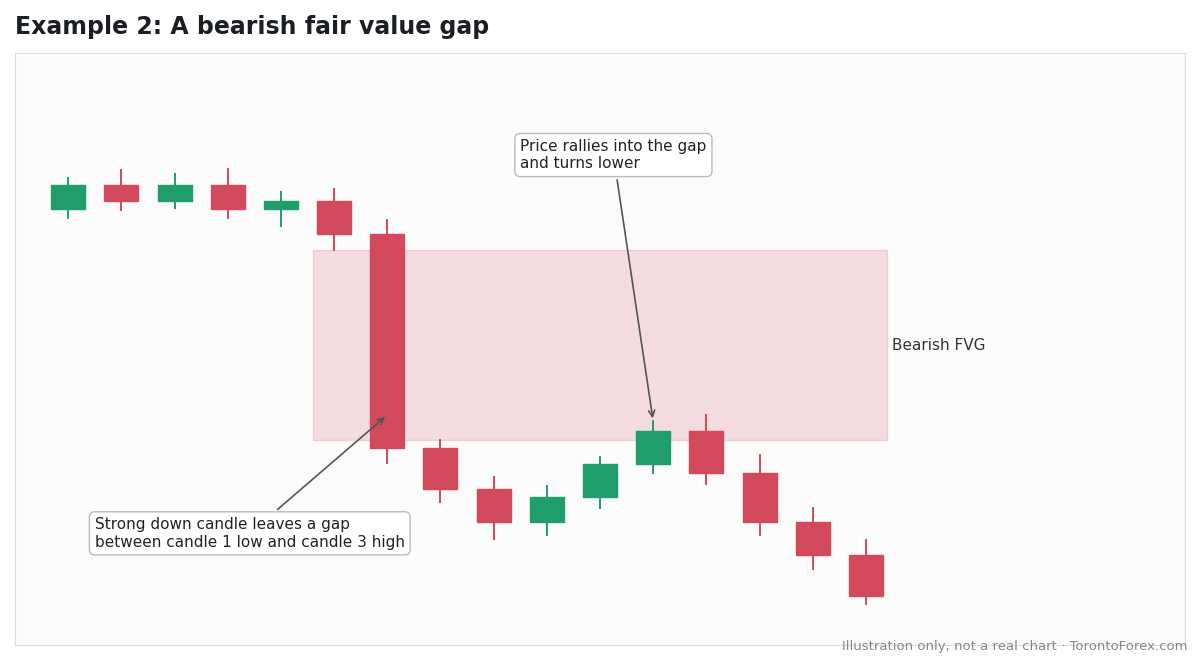
The mirror image. A strong bearish candle leaves a gap, price drops, then rallies back into the gap and sellers return. In a downtrend, that’s where FVG traders look for a short.
Example 3: A gap that gets fully filled
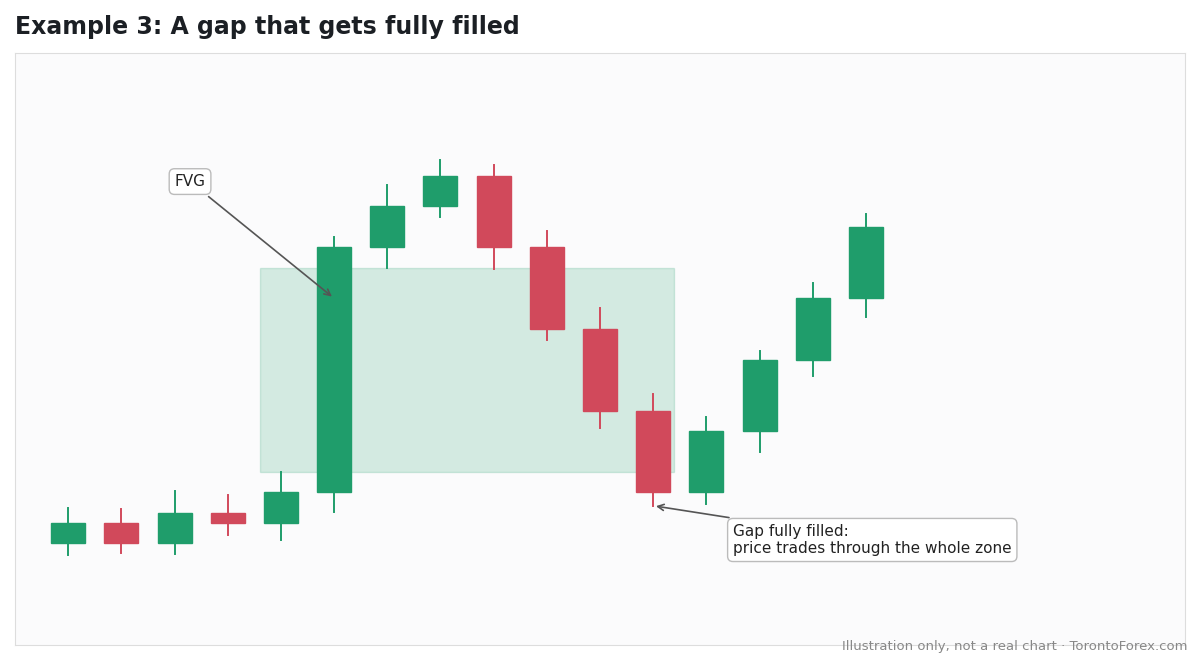
Sometimes price comes back and trades through the whole gap, all the way to the far edge, before reacting. Traders who enter at the near edge of the gap need a stop that allows for this, which is why many place stops beyond the gap, not inside it.
Example 4: A partial fill to the 50% level
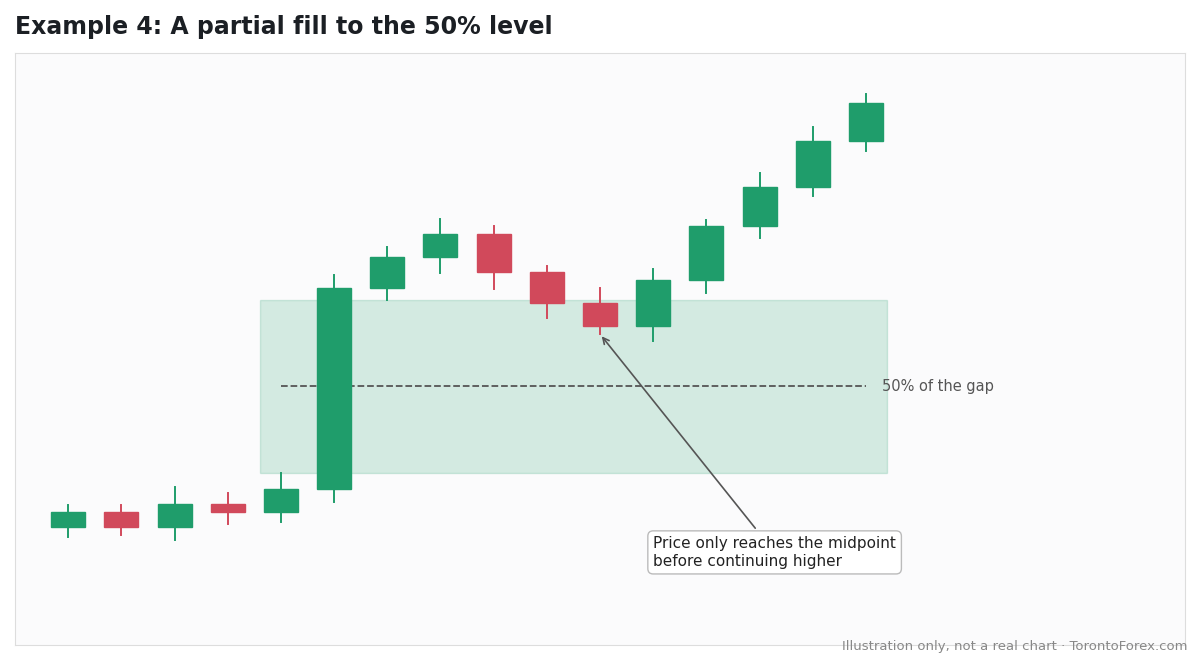
Often price only reaches about halfway into the gap. Many FVG traders watch the 50% level of the gap, sometimes called consequent encroachment, as a likely reaction point. It’s a reminder that the gap is a zone, not a single price, just like the support and resistance zones in our guide to drawing levels.
Example 5: A gap that is never filled
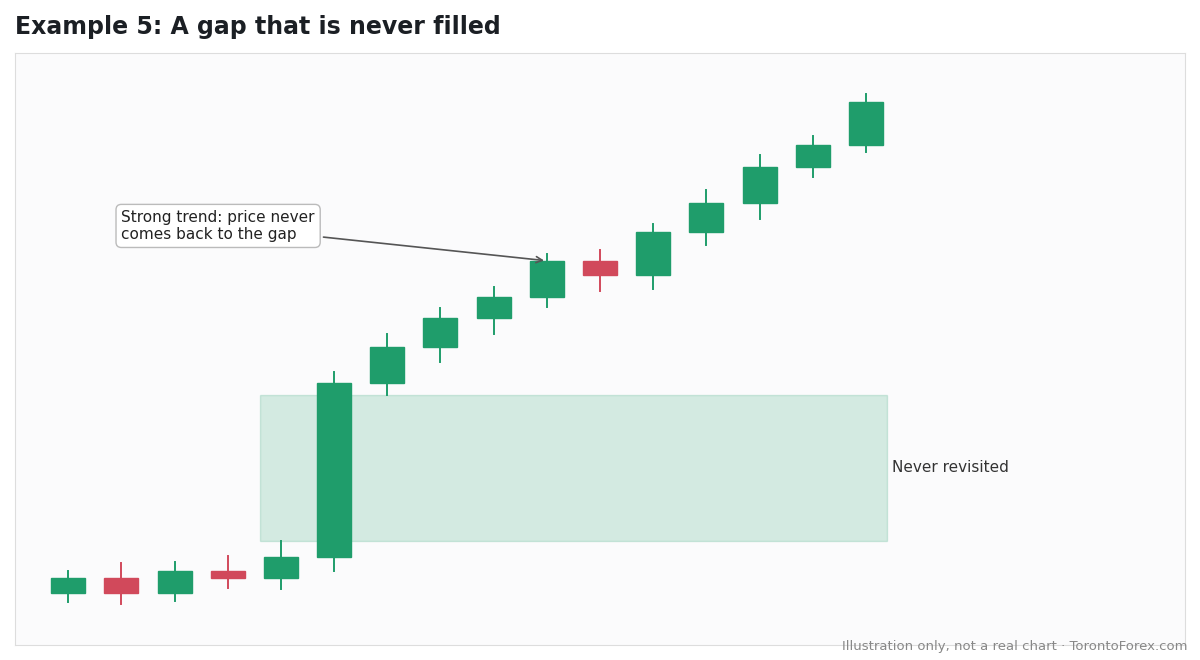
Not every gap gets revisited. In a strong trend, price can leave gaps behind and never return. Waiting for a fill that never comes means missing the move, which is why some traders treat unfilled gaps as a sign of strength rather than a target.
Example 6: A gap that fails
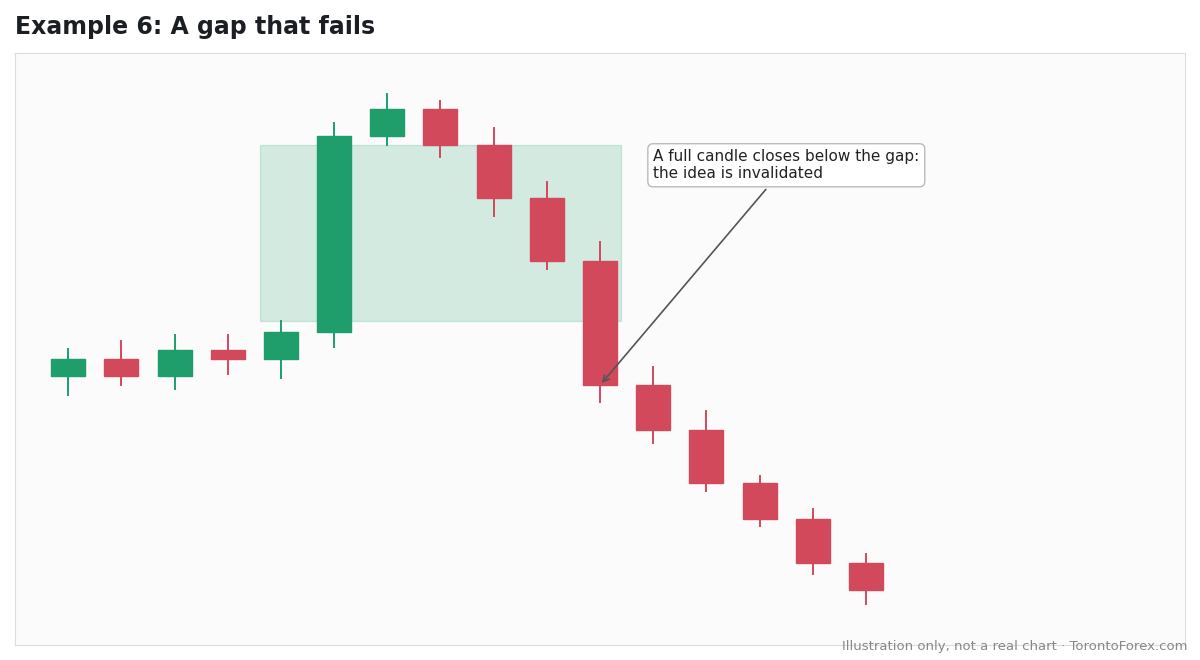
If price returns to a bullish gap and a candle closes clearly below it, the gap has failed. The buyers who were supposed to defend it didn’t. That’s the signal to get out, not to add. Treat a gap like any other trade idea: know in advance what would prove it wrong.
Example 7: An inverse fair value gap
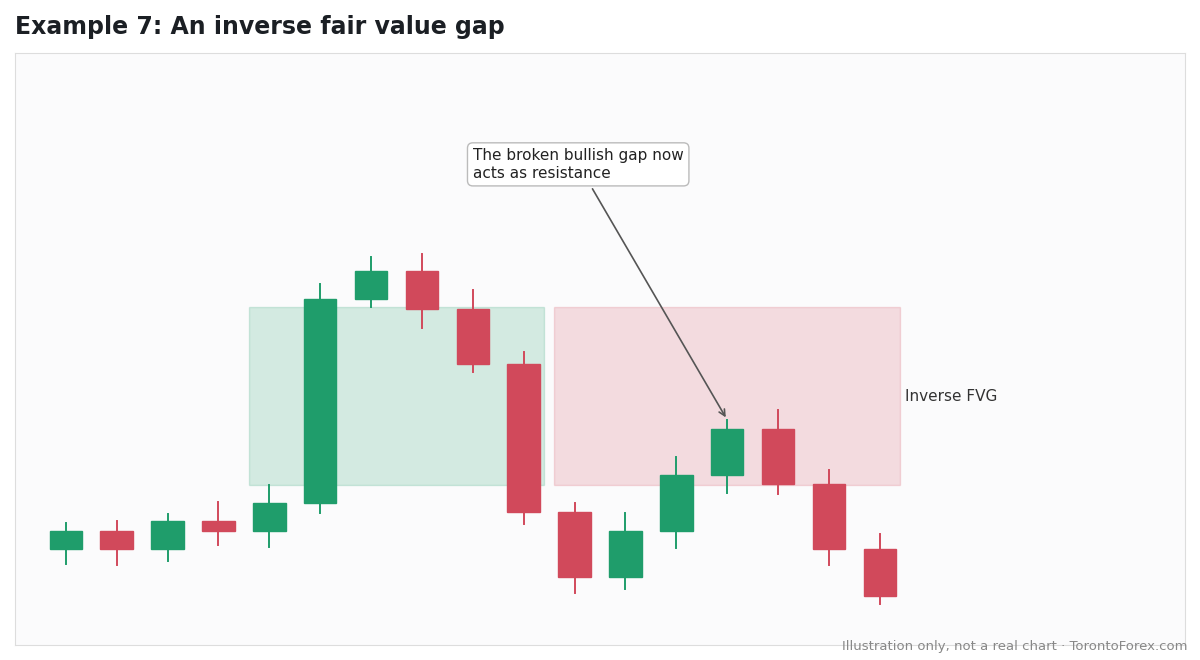
When a gap fails, it can flip roles. A bullish gap that price breaks down through can later act as resistance when price rallies back into it. Traders call this an inverse FVG. It’s the same idea as old support becoming new resistance.
Example 8: A fair value gap after a liquidity sweep
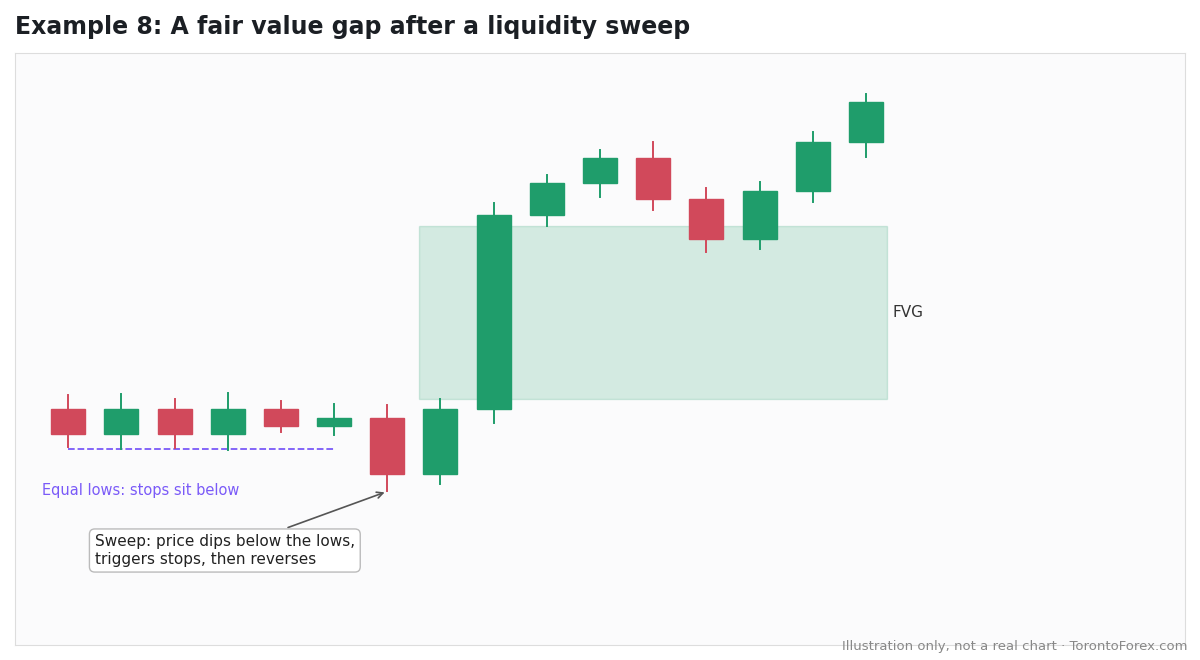
One of the setups FVG traders like most: price dips below an obvious low, triggering stop losses (a liquidity sweep), then reverses sharply and leaves a gap on the way up. The sweep suggests sellers are exhausted; the gap shows buyers stepping in with force. We cover sweeps in detail in our upcoming guide to liquidity sweeps.
Example 9: A gap created by a break of structure
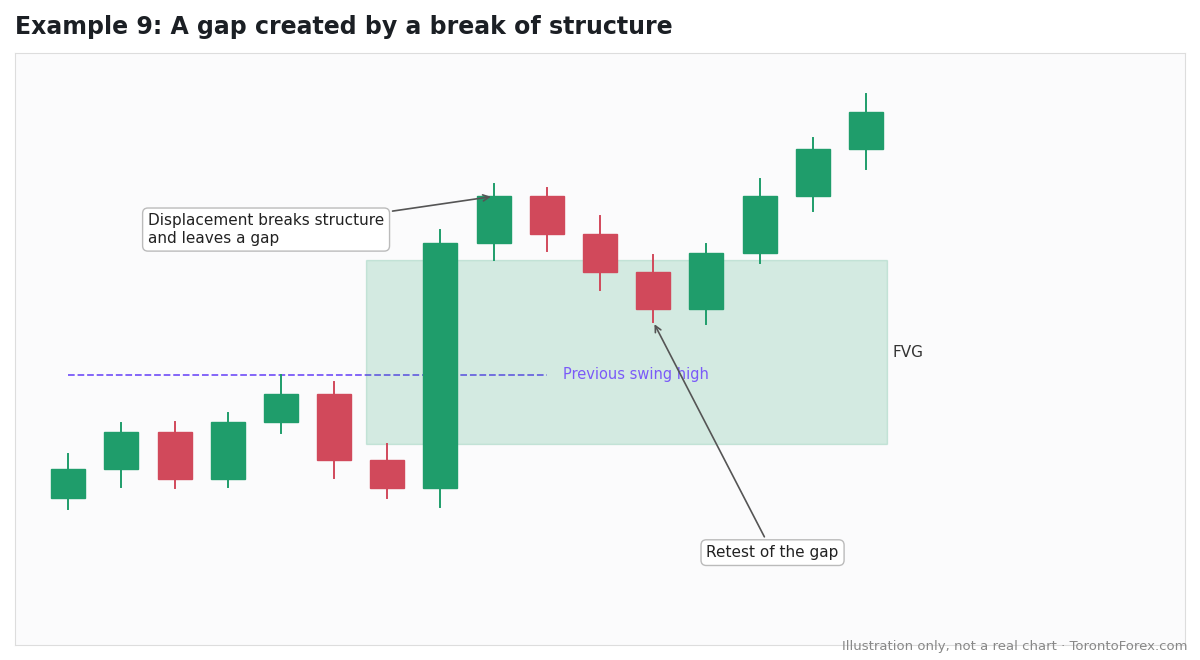
When a strong move breaks a previous swing high, it often leaves a gap behind. That combination, a break of structure plus a gap, suggests real momentum rather than a random spike. Our guide to market structure explains breaks of structure.
Example 10: A news candle that leaves a gap
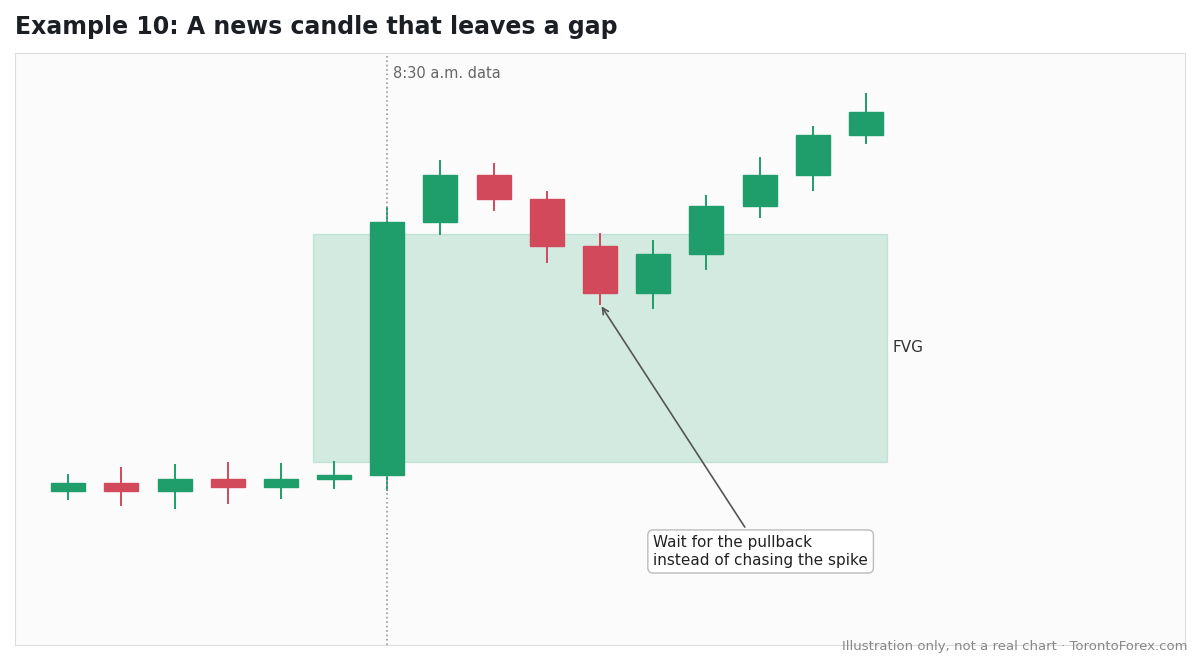
Major data releases, like the 8:30 a.m. US and Canadian reports, often produce a single huge candle that leaves a gap. Rather than chasing the spike, some traders wait for price to pull back into the gap and look for an entry there, once spreads have normalized. Our USD/CAD intraday guide covers how release days unfold.
Example 11: Overlapping gaps (a balanced price range)
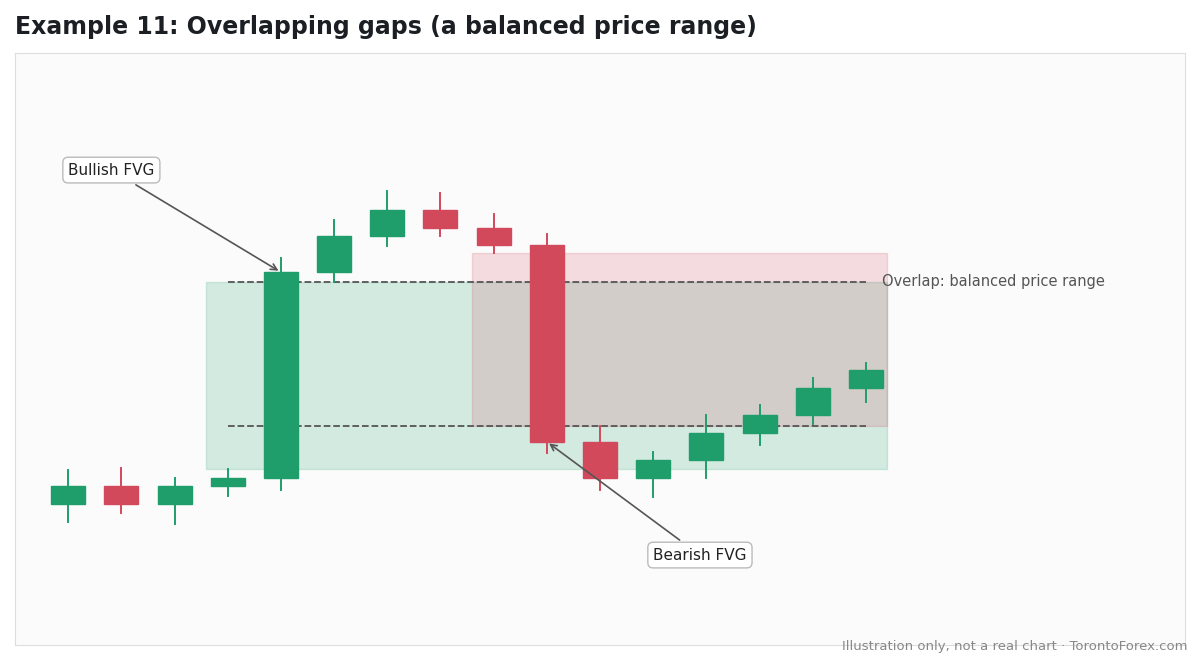
Sometimes a bullish gap is followed by a bearish gap in the same area. The overlap between them is sometimes called a balanced price range. It shows both sides moving aggressively through the same zone, which can make it a meaningful level later.
Example 12: A higher-timeframe gap as a target
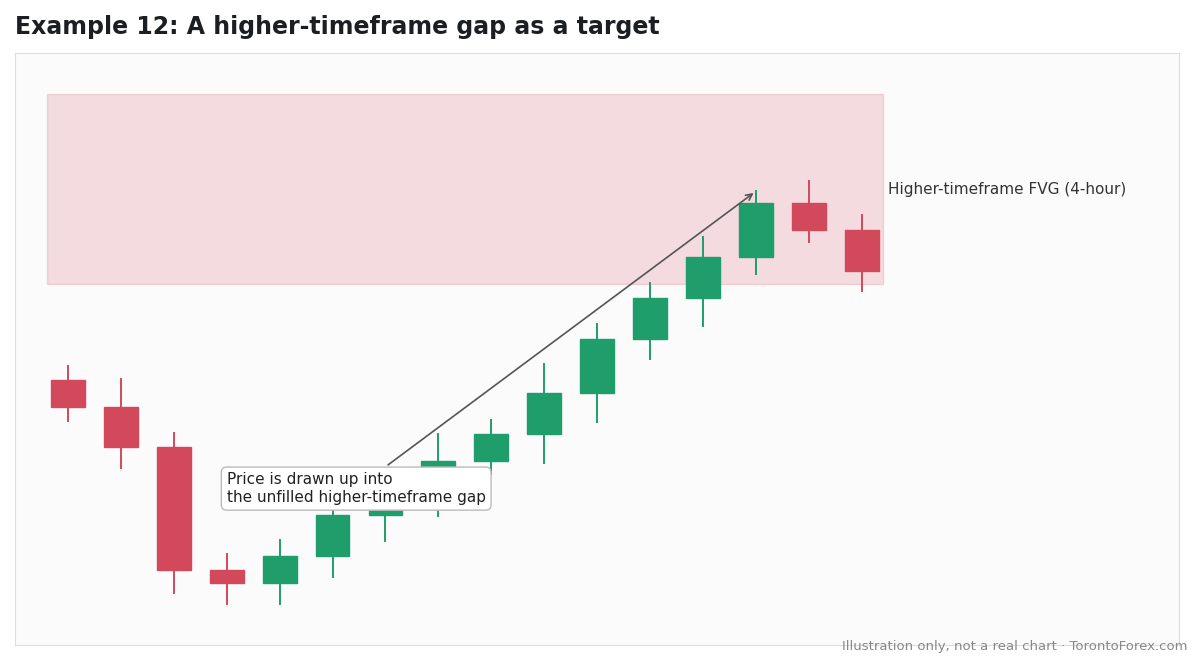
Gaps on higher timeframes, like the 4-hour or daily chart, tend to matter more than gaps on a 1-minute chart. Some traders use an unfilled higher-timeframe gap as a target: if price is moving in that direction, the gap is a logical place to take profit. As always, start from the top down; our top-down analysis guide explains how.
How to use fair value gaps sensibly
Across all 12 examples, a few rules hold:
- Start with the bigger picture. A gap in the direction of the higher-timeframe trend is worth far more than one against it.
- Treat the gap as a zone, with the 50% level as a possible reaction point.
- Put your stop beyond the gap, not inside it.
- Know what invalidates it: a full candle closing through the far side.
- Don’t trade every gap. Lower timeframes produce dozens of them a day. Most are noise.
- Test it. If you want to trade gaps, backtest the rules properly first; our guide to backtesting shows how.
Why did harmonic patterns fade?
If you traded ten or fifteen years ago, you’ll remember when harmonic patterns were everywhere. Gartleys, Bats, Butterflies, Crabs: precise price shapes defined by Fibonacci ratios. The Gartley traces back to H.M. Gartley’s 1935 book Profits in the Stock Market, and Scott Carney developed and named many of the modern patterns, including the Bat, in the late 1990s and 2000s. Today you rarely hear about them. Instead, everyone talks about fair value gaps, liquidity sweeps and Smart Money Concepts.
Why the shift? There’s no single answer, but here’s my read:
- The story is more compelling. Smart Money Concepts come with a narrative: big institutions hunting retail stop losses, and you learning to follow them. That’s an easier story to sell, and to share, than a set of Fibonacci ratios.
- YouTube and social media rewarded it. The terminology was popularized largely through free online content, especially by the trader known as ICT (The Inner Circle Trader), and spread through countless channels in the late 2010s and 2020s. Algorithms reward content that’s simple to explain and easy to spot on a chart.
- Harmonics are demanding. They need precise measurements, there are many variations, and small differences in where you draw a swing change whether a pattern is valid. Many traders found them frustrating and inconsistent.
- Automation made harmonics ordinary. Once indicators could detect patterns automatically, there was less mystique in spotting them.
- The prop firm boom. Short-term, intraday setups suit evaluation-style trading, and SMC concepts are often taught that way.
An important point: much of SMC repackages older ideas. Fair value gaps resemble what traders long called imbalances or gaps. Liquidity sweeps resemble stop runs. Order blocks resemble supply and demand zones. That’s not a criticism; it just means the underlying concepts aren’t new.
And neither approach is proven to work on its own. Harmonic patterns didn’t stop working because markets changed; they fell out of fashion. FVGs and sweeps may follow the same path one day. What lasts is the foundation underneath any method: trend, structure, levels, risk management, and a plan you follow.
The bottom line
A fair value gap is a three-candle pattern where a fast move leaves a range price skipped over. Traders watch for price to return to it, often around the 50% level, and use it as an area of interest rather than a guarantee. Gaps work best in the direction of the higher-timeframe trend, after a liquidity sweep or a break of structure, with a stop beyond the gap and a clear idea of what invalidates it. Harmonic patterns faded largely because of fashion and how trading content spreads, not because they suddenly stopped working. Whatever’s popular, the fundamentals underneath are what count.
Disclosure: The author, Mike Harding, founded Academy of Financial Markets in Toronto and teaches its mentorship program. Charts in this article are illustrations, not real market data. This article is educational and is not financial advice. Trading carries a high level of risk.