
You place a stop just below an obvious low. Price drops, hits your stop by a few pips, and then rallies hard in the direction you originally expected. It feels personal. It isn’t. It’s one of the most common patterns in trading, and it has a name: a liquidity sweep.
This guide explains what liquidity is, where it sits on a chart, how a sweep differs from a real breakout, and walks through six illustrated examples. The charts are illustrations, drawn to show each idea clearly.
What “liquidity” means here
In this context, liquidity means orders waiting in the market. Large traders can’t fill big positions without someone on the other side. Clusters of waiting orders, especially stop losses, provide exactly that.
Think about where stop losses sit:
- Traders who bought tend to place stops just below obvious lows. When triggered, those stops become sell orders. This is often called sell-side liquidity.
- Traders who sold tend to place stops just above obvious highs. When triggered, those become buy orders, called buy-side liquidity.
A liquidity sweep happens when price pushes through one of those levels, triggers the cluster of orders, and then reverses. The move through the level provided the liquidity; once it’s used up, price goes the other way.
Whether that’s deliberate “stop hunting” by big players or simply how markets naturally work around crowded levels is debated. For trading purposes, it doesn’t matter. The pattern is real, and you can learn to recognize it.
Where liquidity tends to sit
- Equal highs and equal lows. Two or three highs or lows at nearly the same price are a magnet for stops.
- The previous day’s high and low.
- Session highs and lows, especially the Asian session range before London opens.
- Round numbers, like 1.3500.
- Obvious support and resistance, the levels everyone can see. Our guide to drawing support and resistance explains why zones beat thin lines for exactly this reason.
Sweep 1: A sweep of equal lows
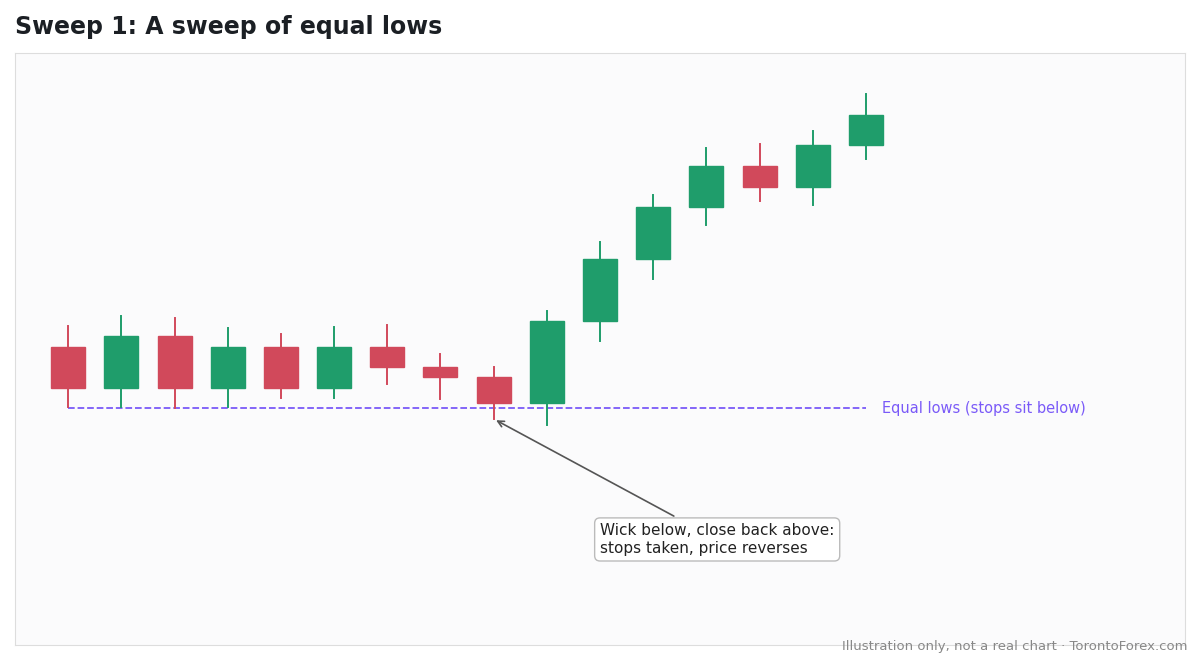
Price forms a row of nearly equal lows. Stops build up underneath. Then a candle wicks below the lows, triggering those stops, but closes back above them. Buyers absorb the selling and price reverses higher. The key detail is the close back above the level.
Sweep 2: A sweep of equal highs
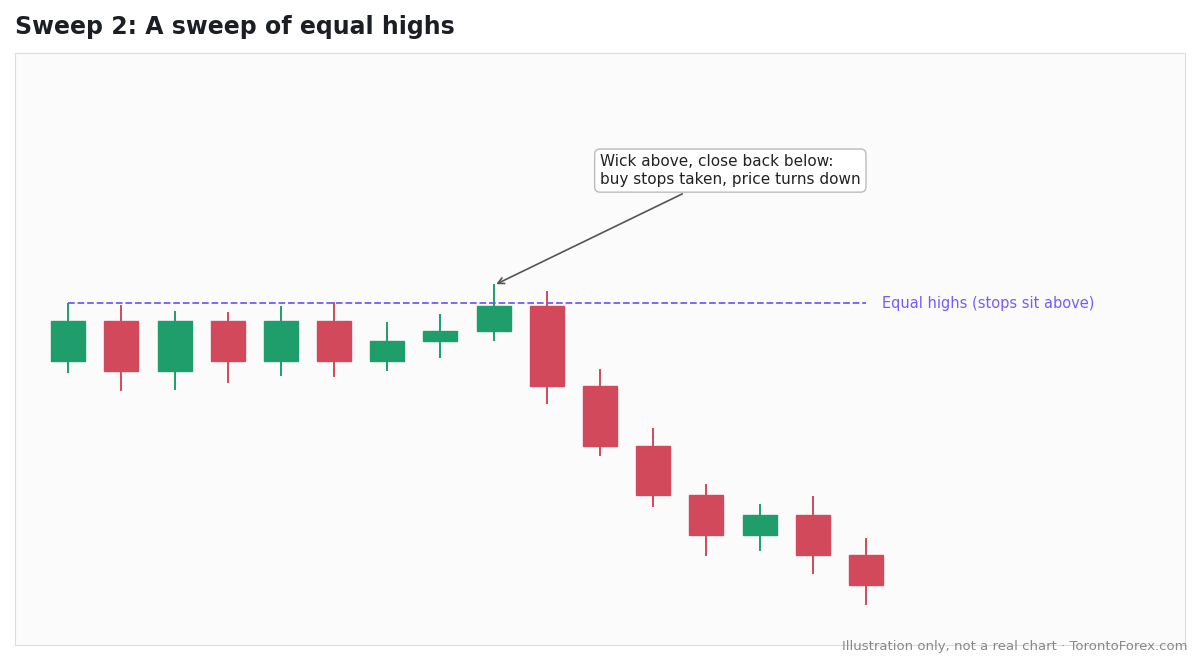
The mirror image. Equal highs collect buy stops above them. Price pokes above, triggers them, closes back below, and turns down.
Sweep 3: A sweep of the previous day’s high
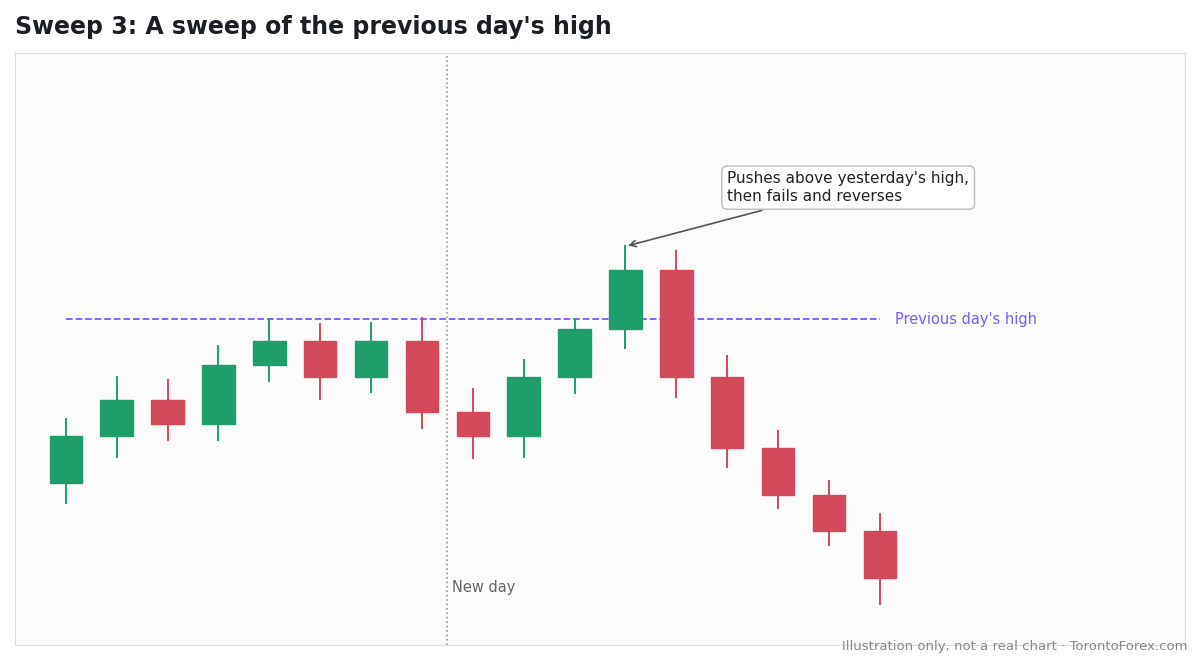
Yesterday’s high and low are levels almost every trader marks. Early in the new day, price pushes above the previous day’s high, triggering breakout buyers and short sellers’ stops, then fails and reverses. A failed break of the prior day’s range is one of the most common sweep setups.
Sweep 4: London sweeping the Asian session low
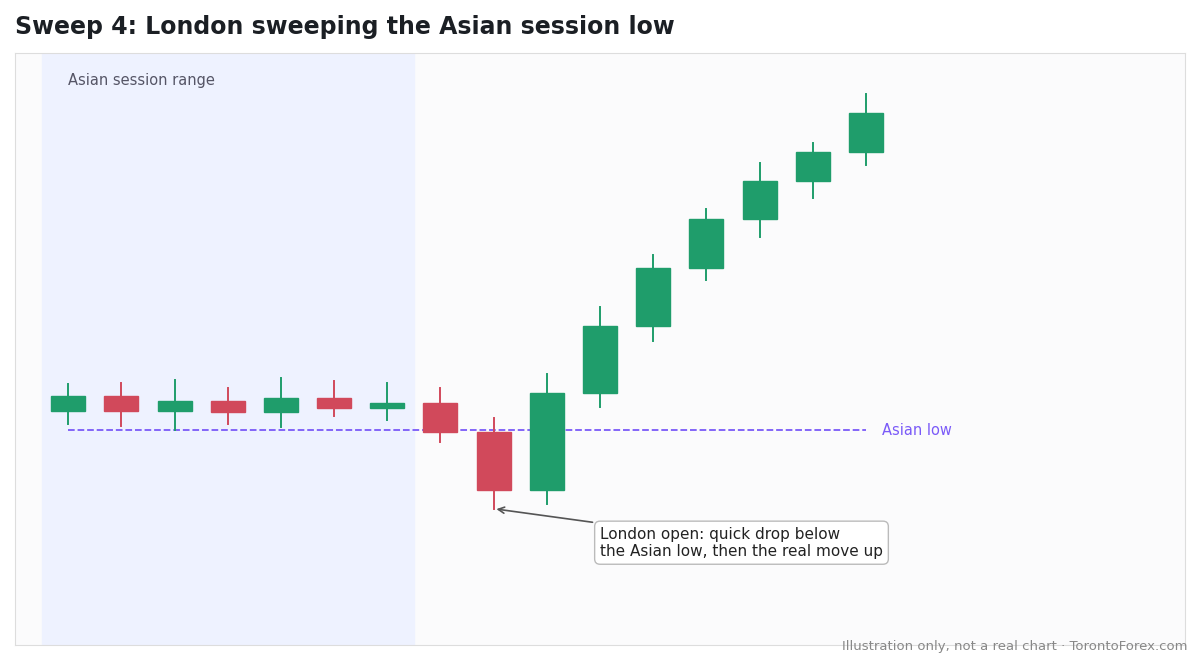
During the Asian session, many currency pairs trade in a tight range. When London opens, price often runs through one side of that range first, sweeping the stops, before the real move of the day goes the other way. For Toronto traders, the London open is around 3 a.m.; see our guide to the London session in Toronto time.
Sweep 5: For comparison, a real breakout
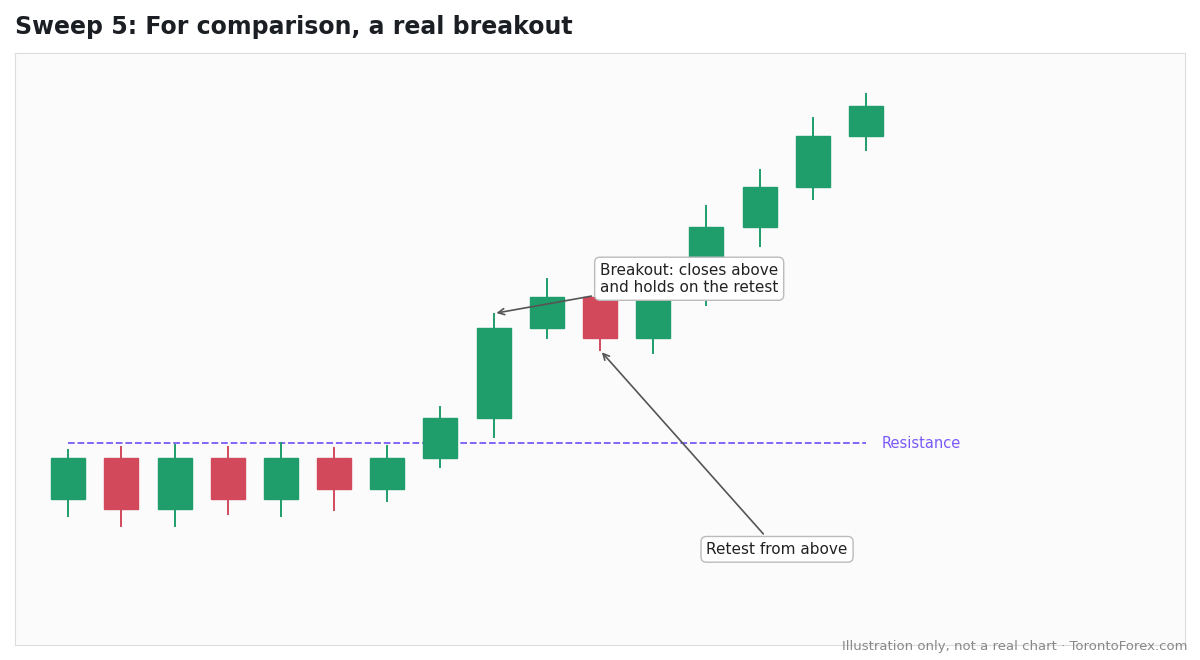
Not every push through a level is a sweep. In a real breakout, price closes beyond the level, keeps closing there, and often comes back to retest it from the other side before continuing. That’s the opposite of a sweep, where price quickly closes back inside.
Sweep 6: When a “sweep” turns into a breakdown
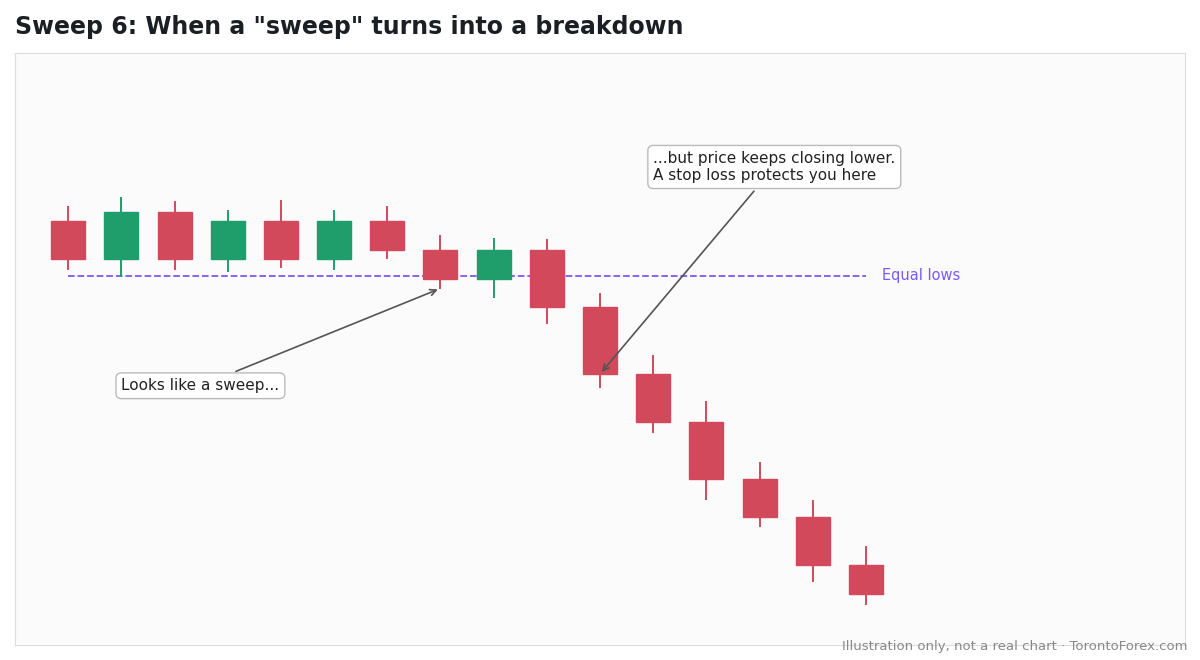
This is the one that hurts. Price dips below the lows and it looks like a classic sweep. You buy, expecting the reversal. Instead, price keeps closing lower. It was a real breakdown, not a sweep. That’s why every sweep trade needs a stop loss beyond the sweep’s extreme, and why waiting for confirmation matters.
Sweep or breakout? How to tell the difference
| Clue | Liquidity sweep | Real breakout |
|---|---|---|
| Close | Closes back inside the level, often quickly | Closes beyond the level and stays there |
| Wick | Long wick through the level | Body through the level |
| Follow-through | Little or none in the breakout direction | Continued closes in the breakout direction |
| Retest | Level isn’t reclaimed | Price often retests the level from the other side |
| Higher timeframe | Often against the bigger trend | Usually with the bigger trend |
No single clue is definitive. Look for several together, and always check the higher-timeframe structure; our guide to market structure explains how.
How traders approach a sweep
A common approach among traders who use sweeps:
- Mark the liquidity in advance: equal highs and lows, the previous day’s range, the Asian range.
- Wait for the sweep: price trades through the level.
- Wait for the close back inside. No close back inside, no sweep.
- Look for a shift on a lower timeframe, such as a change of character in the new direction.
- Enter on a pullback, often into a fair value gap left by the reversal. Example 8 in our fair value gap guide shows how the two combine.
- Place the stop beyond the sweep’s extreme. If price goes back through it, the idea was wrong.
- Target the liquidity on the other side, such as the opposite end of the range.
How to stop being the liquidity
The flip side: if you keep getting stopped out by a few pips before price reverses, your stops are probably sitting where everyone else’s are.
- Avoid placing stops exactly beyond obvious equal highs and lows.
- Give stops room beyond the zone, sized to the instrument’s normal volatility.
- Reduce position size so a wider stop still risks the same amount.
- Be extra careful around session opens and news, when sweeps are common.
The bottom line
A liquidity sweep is a quick push through a level where stop losses cluster, like equal highs or lows, the previous day’s range or the Asian range, followed by a close back inside and a reversal. It’s different from a real breakout, which closes beyond the level and holds. Mark liquidity in advance, wait for the close back inside, confirm on a lower timeframe, and always keep a stop beyond the sweep, because sometimes what looks like a sweep is the start of a real move.
Disclosure: The author, Mike Harding, founded Academy of Financial Markets in Toronto and teaches its mentorship program. Charts in this article are illustrations, not real market data. This article is educational and is not financial advice. Trading carries a high level of risk.