
On one side, the U.S. dollar is being supported by renewed expectations that the Federal Reserve may need to maintain tighter monetary conditions as inflation pressures remain elevated.
On the other side, the Canadian dollar has one of its traditional fundamental supports working in its favour:
oil.
Crude prices have moved back above $100 per barrel amid renewed geopolitical supply concerns, creating a substantially different backdrop for the Canadian dollar than traders were dealing with earlier in the year.
At the same time, the Bank of Canada has already made its September decision.
The Bank held its target for the overnight rate at 2.25% on September 2 while acknowledging that elevated energy prices, U.S. tariffs and Canadian countermeasures continue to complicate the inflation and economic-growth outlook.
That leaves Wednesday’s Federal Reserve decision as the dominant scheduled macro catalyst for USD/CAD this week.
Where USD/CAD Stands Now
USD/CAD entered the second half of September trading around the upper 1.37s and lower 1.38s.
During the previous week, the Canadian dollar strengthened enough to push USD/CAD toward approximately 1.3757 before the pair recovered back toward the 1.38 region.
That places the market directly inside an area I am watching closely.
Rather than simply looking at whether USD/CAD is above or below the psychological 1.3800 handle, I am interested in the broader structure developing around approximately:
1.3850–1.3880.
This region overlaps with several technical references on my chart and is where I am currently evaluating whether the recent decline is beginning to lose momentum.
What the Bank of Canada Just Did
The Bank of Canada held its target for the overnight rate at:
2.25%
at its September 2 policy meeting.
The Bank Rate remained at:
2.50%
while the deposit rate remained at:
2.20%.
The decision was notable because the Bank emphasized several conflicting forces affecting the Canadian economy.
These include:
- elevated global energy prices;
- continuing Middle East geopolitical risk;
- new U.S. tariffs;
- Canadian countermeasures;
- solid U.S. economic growth;
- and continued uncertainty surrounding international trade.
Canada therefore faces an uncomfortable combination.
The economy can experience weaker growth from trade disruptions while simultaneously facing stronger inflation pressure from energy prices.
That is not an easy environment for monetary policy.
Why This Matters for CAD
A central bank does not need to raise rates for its currency to strengthen.
Currency markets trade expectations.
If traders begin believing that the Bank of Canada has less room to ease because inflation risks are increasing, Canadian rate expectations can move higher relative to previous assumptions.
That can support CAD.
On the other hand, evidence of meaningful Canadian economic deterioration could shift attention back toward future monetary easing.
Why Wednesday’s Federal Reserve Decision Matters
The Federal Open Market Committee meets September 15–16.
The policy announcement is scheduled for:
2:00 p.m. Eastern Time on Wednesday, September 16.
The Federal Reserve press conference follows at:
2:30 p.m. Eastern Time.
This meeting is particularly important because it includes a new Summary of Economic Projections.
Traders will be evaluating:
- the actual interest-rate decision;
- the policy statement;
- updated rate projections;
- inflation forecasts;
- economic-growth projections;
- unemployment expectations;
- and the tone of the press conference.
The market is therefore not simply asking:
“What does the Fed do Wednesday?”
The more important question is:
“What does Wednesday’s decision imply about what the Fed does next?”
The First FOMC Move Is Not Always the Final Move
Federal Reserve reactions frequently unfold in stages.
At 2:00 p.m., algorithms and discretionary traders react immediately to the policy decision, statement and projections.
Thirty minutes later, the press conference can completely change the interpretation.
This creates the possibility of:
an aggressive initial move followed by an equally aggressive reversal.
That is why guessing whether the first FOMC candle will be bullish or bearish is not a complete trading strategy.
Oil Above $100 Changes the Canadian-Dollar Equation
Oil prices surged during the previous week as geopolitical supply risks intensified.
Brent crude finished Friday at approximately:
$104.61 per barrel.
Despite Friday’s pullback, Brent still finished the week more than 8% higher.
For Canada, this matters because energy remains a major export industry.
Higher oil prices can improve Canada’s:
- terms of trade;
- export revenues;
- energy-sector cash flow;
- nominal economic activity;
- and demand for Canadian dollars.
Historically, those conditions can support CAD.
But the relationship is not mechanical.
Oil Up Does Not Automatically Mean USD/CAD Down
If oil is rising because of a global inflation shock, U.S. Treasury yields and the U.S. dollar can strengthen at the same time. CAD’s normal benefit from higher energy prices can therefore be partially or completely offset by broader demand for USD.
The Interest-Rate Differential Matters
One of the most important fundamental drivers of currency valuation is the expected difference between interest rates in the two economies.
For USD/CAD, traders are constantly comparing:
expected Federal Reserve policy
against:
expected Bank of Canada policy.
If U.S. rates are expected to remain substantially higher—or move higher relative to Canadian rates—the U.S. dollar can receive support.
If Canadian rate expectations rise faster than U.S. expectations, CAD can strengthen.
This week’s FOMC meeting can therefore alter the expected interest-rate differential within minutes.
USD/CAD Technical Structure
The macro environment explains why volatility may increase.
The chart helps identify where that volatility becomes interesting.
On my current daily USD/CAD chart, price has been moving lower inside a broader descending structure after pulling back from the summer highs.
The pair is now trading near an area where several technical factors begin overlapping.
I have marked:
- major horizontal support and resistance;
- psychological price areas;
- the broader descending structure;
- previous Fibonacci retracement levels;
- and the area where I would want to see bullish confirmation develop.
Rather than chasing USD/CAD after a large move, I am interested in seeing whether this current area can provide a technically attractive location from which to structure a long position.
My USD/CAD Long Trade Plan for the Upcoming Week
For full transparency, USD/CAD is one of the positions I am actively preparing for this week.
My current bias is to look for a potential long USD/CAD position, possibly beginning as early as tomorrow’s session if price action gives me the confirmation I want.
This is not a blind market buy.
I want the market to prove that buyers are beginning to defend the area.
What I Want to See
My preferred sequence would be:
- Price continues respecting the current support region.
- The bearish channel begins losing momentum.
- Buyers start producing stronger reactions from the lows.
- Price begins reclaiming the upper portion of the recent range.
- The market begins challenging the descending structure.
- A breakout or structural shift provides confirmation rather than simply anticipating one.
If that develops, I become increasingly interested in positioning for a move back toward:
1.3970–1.4000.
If momentum expands beyond that area, my next larger area of interest is around:
1.4060–1.4070.
My USD/CAD Technical Chart
The chart below shows the technical structure I am using to prepare the trade.
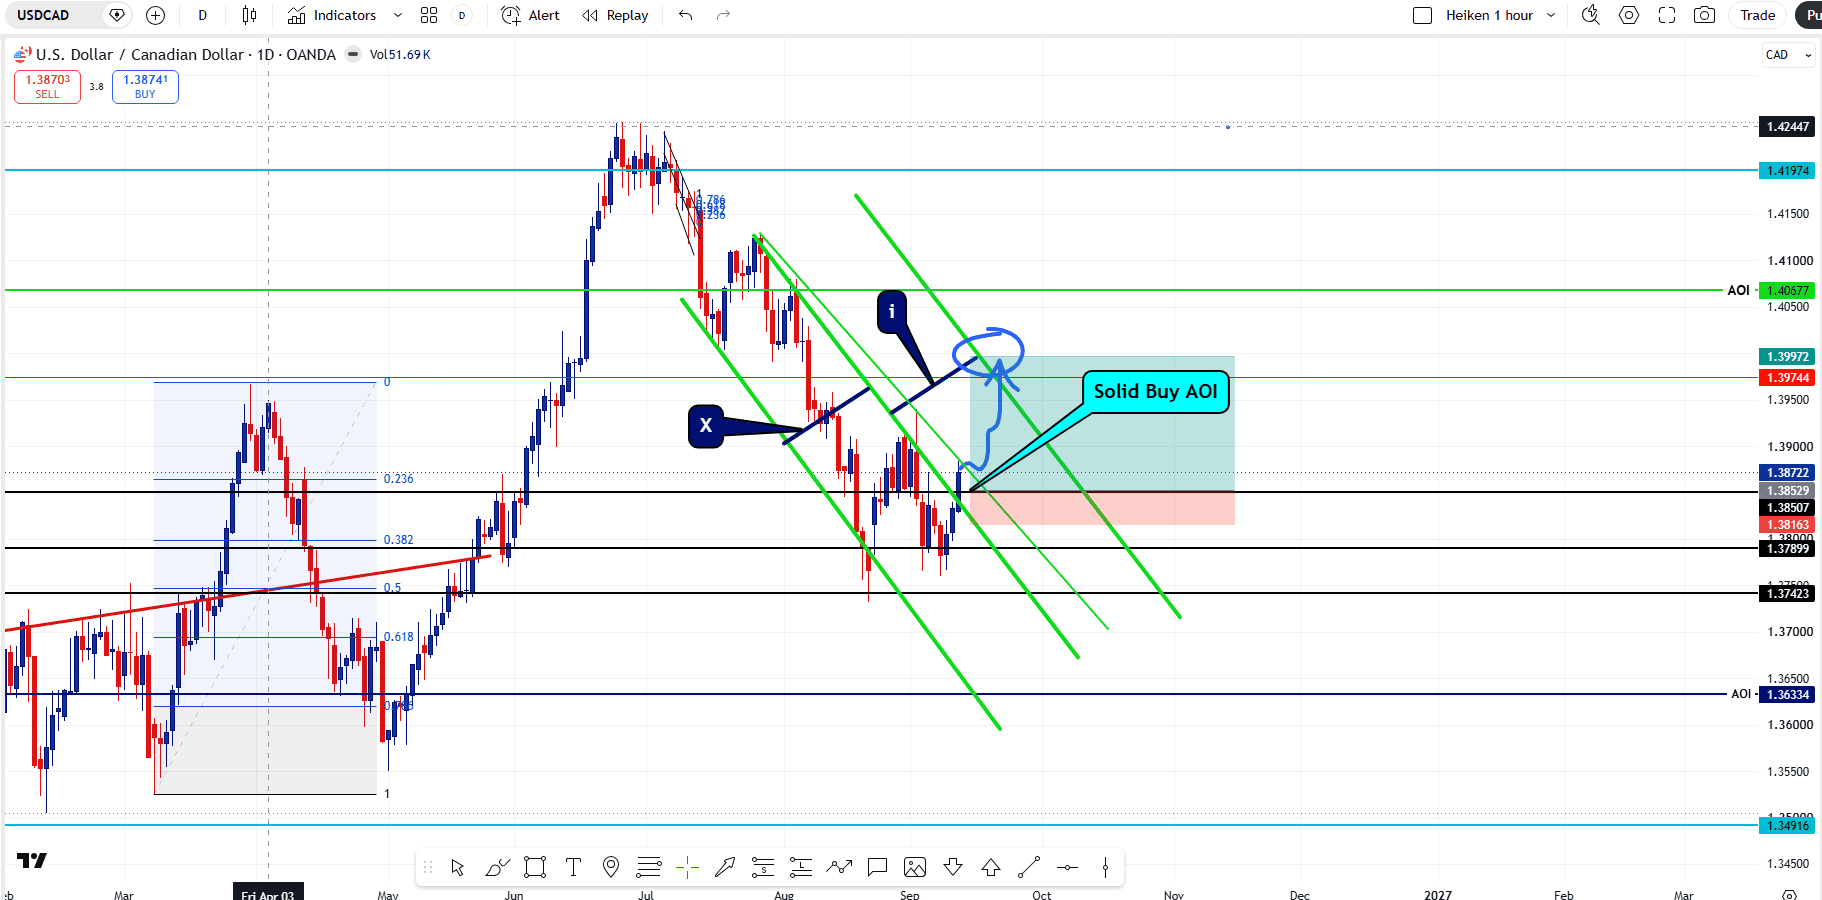
What matters most on this chart is not any one individual line.
It is the confluence.
Price is trading around an area where horizontal support, previous structure and the current descending pattern are beginning to interact.
I have also mapped my alerts around important price levels so I do not need to sit in front of the chart waiting for every small movement.
When price reaches one of my predefined areas, the alert gets my attention.
Then I evaluate the reaction.
That is an important distinction.
An alert is not an entry signal.
It simply tells me that price has reached an area where I want to make a new decision.
Key USD/CAD Levels I Am Watching
| Level / Zone | Role in My Plan | What I Am Watching |
|---|---|---|
| 1.4060–1.4070 | Larger upside area of interest | Possible extension if the 1.4000 region breaks and holds |
| 1.3970–1.4000 | Primary upside objective | Whether price can reclaim the psychological 1.4000 region |
| 1.3850–1.3880 | Current buy area of interest | Buyer response and evidence bearish momentum is weakening |
| 1.3790–1.3815 | Secondary support area | Whether a deeper pullback remains structurally constructive |
| 1.3740 | Lower structural support | Loss of this region would weaken the current long thesis |
| 1.3630 | Major lower area of interest | Potential reassessment area if current support fails |
Levels Are Decision Areas, Not Automatic Orders
These levels are taken from my current technical plan and may change as new price action develops. I use them as areas where I want to evaluate market behaviour—not as automatic instructions to buy or sell.
Why I Am Also Looking Long EUR/USD
The other important part of my positioning for the upcoming week is that I am also watching a potential long EUR/USD.
At first glance, being long both EUR/USD and USD/CAD can look contradictory.
In one trade:
Long EUR/USD = short U.S. dollar exposure.
In the other:
Long USD/CAD = long U.S. dollar exposure.
That is precisely why the combination interests me.
Historically, EUR/USD and USD/CAD have often displayed an inverse relationship because the U.S. dollar sits on opposite sides of the two currency pairs.
When broad U.S. dollar strength pushes EUR/USD lower, USD/CAD has often moved higher.
When broad U.S. dollar weakness pushes EUR/USD higher, USD/CAD has often moved lower.
But correlation is not permanent.
EUR, USD and CAD each respond to their own fundamental forces.
This week, that distinction matters because:
- EUR/USD is being influenced by European monetary policy, U.S. rates and broader dollar positioning;
- USD/CAD is being influenced by U.S. rates, Bank of Canada expectations and energy prices;
- oil above $100 creates an important independent driver for CAD;
- and the Federal Reserve can materially change the USD side of both trades.
Why I Like the Combination
The objective is not to neutralize all market risk.
The objective is to avoid making one oversized directional bet entirely dependent on the U.S. dollar moving one way.
Instead, I am potentially expressing two different relative-value views:
- EUR strength versus USD;
- USD strength versus CAD.
That creates a three-currency view involving EUR, USD and CAD rather than one simple “U.S. dollar up” or “U.S. dollar down” trade.
The two setups still need to qualify independently.
I will not buy USD/CAD simply because I am considering EUR/USD long.
I will not buy EUR/USD simply because I want to offset my USD/CAD position.
Each trade needs:
- its own technical setup;
- its own confirmation;
- its own invalidation;
- its own position size;
- and its own reason for being in the portfolio.
Full Transparency: Positions I Am Watching This Week
For transparency, these are two of the positions currently on my radar for the upcoming week.
| Market | Current Bias | What I Need to See | Underlying View |
|---|---|---|---|
| EUR/USD | Potential Long | Bullish confirmation from support and favourable market structure | EUR strength / USD weakness |
| USD/CAD | Potential Long | Current support holds, bearish momentum weakens and structure begins to reclaim | USD strength / CAD weakness |
These are planned setups.
They are not guaranteed entries.
There is an important distinction between:
having a trade idea
and:
having a valid trade.
I can be interested in USD/CAD long Sunday evening and still take absolutely no position Monday if price does not behave the way I need it to.
That is the entire purpose of planning the week ahead.
EUR/USD — potential long.
USD/CAD — potential long.
Both positions will be evaluated independently. Neither trade gets executed simply because it is on my watchlist. I want price confirmation before committing risk.
What Strengthens My USD/CAD Long Setup?
The bullish USD/CAD thesis becomes stronger if several conditions begin occurring together.
Those could include:
- the current support region holding;
- higher intraday lows beginning to form;
- price breaking the recent descending structure;
- USD/CAD reclaiming approximately 1.3900;
- the Federal Reserve delivering a hawkish message;
- U.S. Treasury yields moving higher;
- and oil failing to generate additional CAD strength.
In that environment, my attention shifts toward:
1.3970–1.4000.
If price can break and establish acceptance above the psychological 1.4000 region, I would then reassess whether:
1.4060–1.4070
becomes a realistic extension area.
What Invalidates My USD/CAD Long Idea?
I am not married to the trade.
This matters.
A trading thesis is useful only if there is something the market can do to prove it wrong.
If USD/CAD begins accepting below the current support structure without a meaningful bullish response, my willingness to buy decreases.
A deeper move through approximately:
1.3790–1.3740
would force me to reassess whether the market is actually ready to reverse.
If the current structure fails entirely, the larger:
1.3630 area
becomes relevant on my chart.
The level gets my attention.
The reaction determines the trade.
What I Will Watch Immediately After FOMC
Wednesday’s first reaction may not be the final reaction.
I plan to evaluate the event in stages.
Stage 1: 2:00 p.m. ET
I will watch:
- the policy decision;
- statement language;
- the rate projections;
- inflation forecasts;
- economic-growth forecasts;
- and the immediate Treasury-yield reaction.
Stage 2: The First 15–30 Minutes
I want to determine whether:
- the dollar move is broad-based;
- U.S. yields confirm it;
- USD/CAD can hold outside its pre-event range;
- or the first move immediately begins reversing.
Stage 3: The 2:30 p.m. Press Conference
The press conference can materially change the market’s interpretation of the statement.
If USD/CAD aggressively rallies at 2:00 p.m. and then gives back the entire move during the press conference, that is important information.
The opposite is also true.
Stage 4: Where the Market Actually Closes
For the larger swing idea, I care considerably more about where USD/CAD trades once the immediate event volatility settles than I do about the first five-minute FOMC candle.
Why Oil and the Canadian Dollar Can Diverge
It is tempting to reduce the Canadian dollar to one simple relationship:
Oil up = CAD up.
Real markets are more complicated.
Oil can rise because global energy supply is being disrupted.
If the same disruption causes:
- global inflation expectations to increase;
- U.S. Treasury yields to rise;
- Federal Reserve expectations to become more hawkish;
- and demand for U.S. dollars to increase;
USD can strengthen even while crude remains elevated.
That is one reason the current USD/CAD environment is particularly interesting.
Two important fundamental drivers can pull the pair in opposite directions.
Risk Management During Fed Week
This is not the week to confuse conviction with position size.
FOMC volatility can produce:
- spread expansion;
- slippage;
- rapid stop-outs;
- false breakouts;
- liquidity gaps;
- and aggressive reversals.
A stop loss does not guarantee an exact fill during fast market conditions.
There is another risk consideration this week because I am looking at both EUR/USD and USD/CAD.
I need to consider the combined USD exposure across both positions.
The two trades have opposite dollar exposure, but that does not mean the portfolio becomes risk-free.
I still need to evaluate:
- risk on each trade;
- combined open risk;
- EUR-specific exposure;
- CAD-specific exposure;
- event risk;
- and the possibility that both setups fail independently.
Our guide to risk per trade explains why position size should reflect the actual account and strategy rather than an arbitrary percentage.
My Practical Week-Ahead Trading Plan
Sunday / Before the Week Begins
- Mark the important USD/CAD technical areas.
- Set alerts around the levels that matter.
- Identify the current EUR/USD and USD/CAD setups.
- Review the week’s economic calendar.
- Determine maximum risk before placing a trade.
Early Week
- Watch whether USD/CAD buyers defend the mid-1.38 area.
- Look for evidence the descending structure is weakening.
- Monitor EUR/USD independently for its own long confirmation.
- Watch oil and Treasury yields for confirmation or divergence.
- Do not force either position simply because it is part of the plan.
Before FOMC
- Reassess open positions.
- Know exactly how much risk remains.
- Decide in advance whether positions will be held through the event.
- Account for spread and slippage risk.
- Do not increase size simply because the event is important.
After FOMC
- Allow the first reaction to develop.
- Watch the press conference.
- Reassess the daily chart structure.
- Determine whether USD/CAD established a genuine breakout or rejection.
- Update the EUR/USD and USD/CAD theses independently.
- Use the post-Fed structure to plan the remainder of the week.
Practice the Process Before Risking Live Capital
Weekly planning is useful whether the trade eventually occurs or not.
For traders who are still developing their execution process, a demo account provides a place to practice:
- position sizing;
- pending orders;
- alert-based planning;
- stop placement;
- news-event risk;
- and trade management
without initially exposing live trading capital.
Open an OX Securities Demo Account
Use a demo account to practice USD/CAD and EUR/USD execution, position sizing and event-risk management before deciding whether a live personal trading account is appropriate.
Frequently Asked Questions
When is the September 2026 Federal Reserve decision?
The Federal Reserve’s September meeting takes place September 15–16, 2026. The policy announcement is scheduled for 2:00 p.m. Eastern Time on Wednesday, September 16, followed by the press conference at 2:30 p.m.
What is the current Bank of Canada policy rate?
The Bank of Canada maintained its target for the overnight rate at 2.25% at its September 2, 2026 decision.
Why does oil matter for USD/CAD?
Canada is a major energy exporter. Higher oil prices can improve Canadian export revenues and terms of trade, which can support CAD. Other factors including interest-rate expectations, economic growth and broad U.S. dollar demand can nevertheless override that relationship.
Am I currently long USD/CAD?
This article describes a potential position I am preparing for. My intention is to look for a long setup if the current support region produces the confirmation I want. A planned trade is not the same thing as an executed position.
What is my USD/CAD upside area?
The first major upside area I am watching is approximately 1.3970–1.4000. If the pair establishes a convincing breakout above that region, approximately 1.4060–1.4070 becomes the next larger area on my current chart.
What would weaken the USD/CAD long setup?
A sustained loss of the current mid-1.38 support structure, particularly a deeper move through approximately 1.3790–1.3740 without a meaningful bullish response, would materially weaken the setup and cause me to reassess the trade.
Why am I considering long EUR/USD and long USD/CAD at the same time?
Long EUR/USD creates short USD exposure while long USD/CAD creates long USD exposure. This reduces my dependence on one simple directional U.S. dollar view, while allowing me to express separate views on EUR and CAD.
Are EUR/USD and USD/CAD a perfect hedge?
No. Their correlation changes over time and both trades can lose simultaneously. I view the combination as diversified currency exposure rather than a guaranteed hedge.
Should traders enter USD/CAD immediately after FOMC?
That depends on the trading strategy. FOMC announcements can produce rapid repricing, wider spreads and reversals. Waiting for post-event structure is a legitimate approach.
Why are psychological levels important?
Round-number areas can attract orders and trader attention. I treat them as areas where reaction should be evaluated rather than automatic buy or sell signals.
Final Perspective
USD/CAD enters Fed week with an unusually interesting mix of technical and fundamental forces.
The U.S. dollar has potential support from:
- firm U.S. economic conditions;
- inflation concerns;
- higher Treasury yields;
- and the possibility of tighter Federal Reserve policy.
The Canadian dollar has potential support from:
- oil above $100;
- Canada’s energy-export exposure;
- and the possibility that renewed inflation pressures constrain future Bank of Canada easing.
But the macro narrative alone is not enough for me to take the trade.
My USD/CAD chart is now sitting in an area where I want to see whether buyers are prepared to step in.
For full transparency, my current plan for the upcoming week includes:
EUR/USD — potential long.
USD/CAD — potential long.
The USD/CAD setup interests me around the current mid-1.38 region, with approximately:
1.3970–1.4000
as the first significant upside area if the bullish structure confirms.
I am not trying to predict every candle between here and there.
I have already done the part I can control:
- identified the levels;
- marked the chart;
- set alerts;
- defined the potential setup;
- identified what would invalidate the idea;
- and reviewed the major economic catalyst for the week.
The next part belongs to the market.
The level gets my attention.
The reaction determines the trade.
That is the purpose of planning the week before the volatility arrives.
Continue through our Insights, Canada, Market Hours, Education and Risk Management sections for additional research.