
FOMC Week Ahead: XAU/USD, EUR/USD & Key Levels Traders Should Watch
The Federal Reserve takes centre stage this week following another firm U.S. inflation report. With markets heavily pricing a September rate hike, traders should prepare for volatility across gold, EUR/USD, Treasury yields and the U.S. dollar before Wednesday’s decision—not after the first candle starts moving.
Sunday is when I want to do most of my thinking for the trading week.
Not because I am trying to predict exactly where every market will go, but because I want to know where the important decisions are likely to be made before price gets there.
This week is a perfect example.
The Federal Open Market Committee meets on Tuesday and Wednesday, September 15–16, with the Federal Reserve’s policy announcement scheduled for 2:00 p.m. Eastern Time on Wednesday. Chair Kevin Warsh’s press conference begins at approximately 2:30 p.m. ET.
This is also one of the Fed meetings accompanied by updated economic projections, meaning traders will receive more than a simple rate decision. The market will also examine the Federal Reserve’s updated outlook for inflation, growth, unemployment and future interest rates.
That makes this one of the most important macro events on September’s calendar.
Why Plan the Trading Week on Sunday?
A trading plan does not tell you what the market must do.
It tells you what you intend to do if the market does something important.
That distinction matters.
When I prepare on Sunday, I want to identify:
- major economic releases;
- central-bank meetings;
- important psychological price levels;
- higher-timeframe support and resistance;
- areas where multiple technical factors converge;
- and specific prices where I want an alert instead of staring at a screen all day.
The goal is to reduce decision-making when markets become emotional.
FOMC days can produce some of the fastest moves in forex and gold because several markets react simultaneously:
- U.S. Treasury yields;
- the U.S. dollar;
- gold;
- equities;
- oil;
- and interest-rate futures.
If you wait until 1:59 p.m. Wednesday to decide what matters, you are already late.
This is why weekly preparation belongs inside a trader’s broader trading education and risk-management process.
What Is the FOMC?
The Federal Open Market Committee is the Federal Reserve body responsible for setting U.S. monetary policy.
Its decisions influence the federal funds rate and financial conditions throughout the global economy.
Interest rates affect:
- borrowing costs;
- bond yields;
- the relative attractiveness of the U.S. dollar;
- equity valuations;
- commodity pricing;
- gold;
- and international capital flows.
That is why a Federal Reserve decision can move EUR/USD, USD/CAD, XAU/USD and U.S. stock indices within seconds.
This Week’s FOMC Schedule
| Date | Event | Toronto / Eastern Time | Why It Matters |
|---|---|---|---|
| Tuesday, Sept. 15 | FOMC meeting begins | All day | Policy deliberations begin |
| Wednesday, Sept. 16 | U.S. Import/Export Prices | 8:30 a.m. | Additional inflation information before the Fed |
| Wednesday, Sept. 16 | FOMC Statement & Rate Decision | 2:00 p.m. | Policy rate and official statement released |
| Wednesday, Sept. 16 | Summary of Economic Projections | 2:00 p.m. | Updated rate, inflation, growth and unemployment projections |
| Wednesday, Sept. 16 | Fed Chair Press Conference | 2:30 p.m. | Markets interpret the Fed’s forward guidance |
The Federal Reserve’s official calendar confirms that September 15–16 is a two-day FOMC meeting and that this meeting includes updated projection materials.
Where the Federal Reserve Stands Before Wednesday
The Fed entered this meeting with its target federal funds rate currently at:
3.50%–3.75%.
At the July meeting, policymakers voted to leave rates unchanged.
But that decision was not unanimous.
Three FOMC participants preferred to increase rates by 25 basis points at that meeting.
That is important because Wednesday’s meeting is not beginning from a position where every Fed policymaker clearly favours holding rates steady.
The July statement also acknowledged that inflation remained elevated relative to the Fed’s 2% goal.
Since then, the inflation picture has not become significantly more comfortable.
What Friday’s CPI Report Changed
Friday’s U.S. Consumer Price Index was the final major inflation report before the September Fed decision.
The August numbers showed:
| Inflation Measure | August 2026 |
|---|---|
| Headline CPI — Monthly | +0.4% |
| Headline CPI — Year over Year | +3.4% |
| Core CPI — Monthly | +0.3% |
| Core CPI — Year over Year | +2.4% |

Headline inflation accelerated from July’s 0.1% monthly increase.
Core CPI’s 0.3% monthly rise was also stronger than markets had hoped to see heading into the Fed meeting.
The report mattered because it strengthened the argument that the Federal Reserve cannot yet declare victory over inflation.
It also followed a strong Producer Price Index report the previous day.
By Friday afternoon, futures markets were assigning roughly an 85%–87% probability of a 25-basis-point Fed hike.
That is a major change in expectations.
The rate decision itself may not be the biggest surprise
When a market is already pricing a high probability of a specific decision, the bigger move can come from the difference between what was expected and what policymakers communicate about the future.
Why Oil Has Become Part of the Fed Story
One reason this Fed meeting is more complicated than usual is energy.
Brent crude surged during the previous week and briefly traded near $110 per barrel as geopolitical tensions disrupted energy markets.
Although oil eased Friday, it still finished the week dramatically higher.
Higher energy prices can affect inflation far beyond gasoline.
Energy costs feed into:
- transportation;
- air travel;
- manufacturing;
- shipping;
- agriculture;
- consumer goods;
- and supply chains.
The August CPI report already showed gasoline prices rising sharply.
That gives the Federal Reserve another reason to remain focused on inflation expectations even if some underlying components continue cooling.
What Markets Currently Expect From the Fed
The market enters Sunday heavily leaning toward a 25-basis-point rate increase.
If that happens, the target range would move from:
3.50%–3.75%
to:
3.75%–4.00%.
But traders need to understand something very important:
A rate hike is not automatically bullish for the U.S. dollar and bearish for gold.
If virtually everyone expects the hike, the decision can already be partly reflected in current prices.
The market then asks:
- Was the vote unanimous?
- Does anyone favour a larger hike?
- Does anyone still favour holding?
- How does the Fed describe inflation?
- How does it describe economic growth?
- What happens to the projected rate path?
- Does Chair Warsh suggest additional hikes are likely?
- Or does he frame Wednesday’s move as sufficient for now?
Five Things That Matter More Than Just “Hike or Hold”
1. The Size of the Rate Move
A 25-basis-point hike is currently the market’s main expectation.
A hold would therefore represent a meaningful surprise.
A larger move would be an even more significant hawkish shock.
2. The Statement
Markets will compare the September language line by line with July.
Pay particular attention to how the Fed describes:
- inflation;
- labour-market conditions;
- economic activity;
- energy-driven price pressures;
- and future policy adjustments.
3. The Updated Projections
Because this is a projections meeting, markets will receive new Fed forecasts.
Those projections can change expectations for:
- 2026 rates;
- 2027 rates;
- inflation;
- GDP growth;
- unemployment.
4. The Vote
July produced three dissenters who wanted higher rates.
Wednesday’s vote can show whether hawkish support has broadened.
5. Kevin Warsh’s Press Conference
The first reaction at 2:00 p.m. can reverse completely when the press conference begins thirty minutes later.
This is one reason I do not treat the first FOMC candle as the final market interpretation.
My XAU/USD Setup for FOMC Week
Gold is the market I am watching most closely this week.
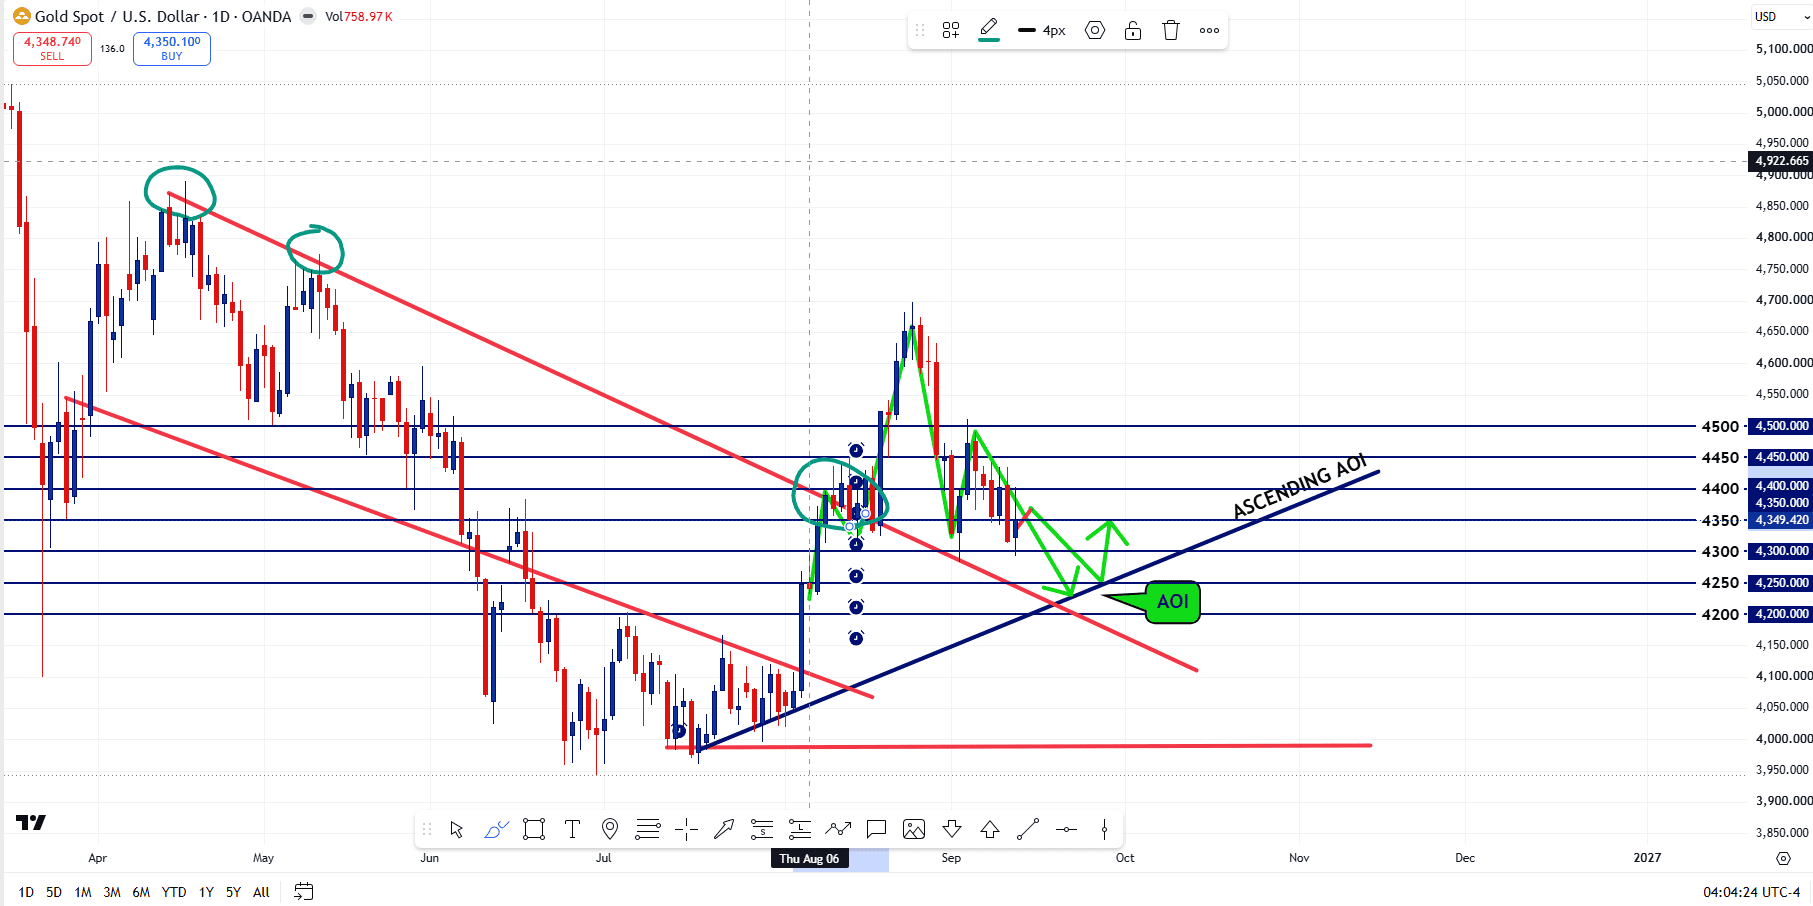
My daily XAU/USD chart is built around a simple concept:
I want the important prices identified before price reaches them.
I have psychological levels marked every $50 across the area currently relevant to price:
4200 4250 4300 4350 4400 4450 4500
I also have alerts around these areas.
That means I do not need to stare at XAU/USD all day waiting for something to happen.
When price reaches an area I have already decided matters, I can then move down in timeframe and evaluate the actual reaction.
The Larger Technical Structure
The daily chart shows two major structural features.
First, gold has been trading beneath a declining resistance structure extending from the earlier highs.
Second, price has developed a rising support line from the summer low.
Those structures begin to compress the market.
That makes Wednesday’s macro catalyst particularly interesting because a major event can provide the volatility required to test or break one of those areas.
My Preferred Area of Interest
The area I would personally find most interesting is a deeper FOMC-driven decline toward the rising daily support.
Based on the chart as it stands today, that support begins to converge with the broader:
4200–4250 region.
I have that area marked as an AOI — Area of Interest.
This is an important distinction.
An area of interest is not the same thing as an entry.
If gold sells into 4250 or 4200 during FOMC volatility, I would want to observe:
- how quickly price reaches the area;
- whether the move is driven by rising yields and dollar strength;
- whether sellers remain aggressive after the initial impulse;
- whether a lower timeframe forms a rejection;
- whether the level is reclaimed after being temporarily broken;
- and whether the Fed press conference confirms or contradicts the first market reaction.
What Friday’s CPI Reaction in Gold Tells Us
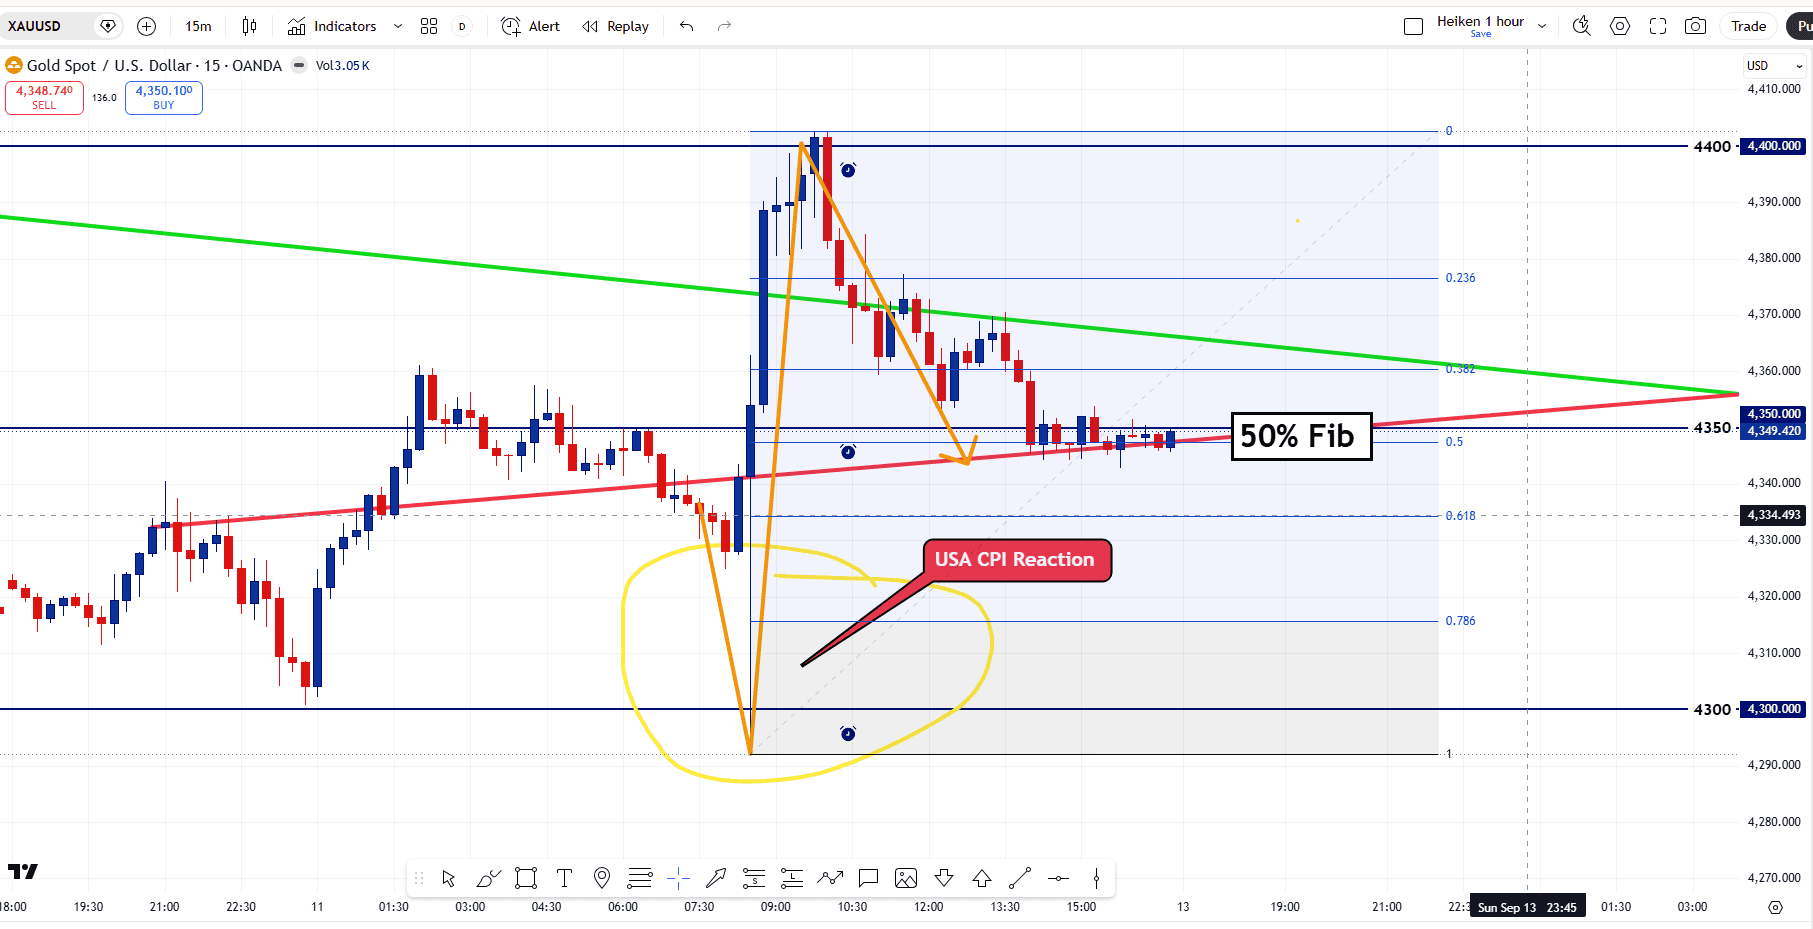
The smaller-timeframe chart provides an excellent example of why traders should be careful about interpreting the first reaction to economic data.
Immediately around Friday’s CPI release, XAU/USD sold aggressively.
Price dropped toward roughly the:
4290–4300 area.
Then the market reversed violently.
Gold rallied all the way into the major psychological:
4400 handle.
That was followed by another retracement.
By the end of Friday, price had returned toward approximately:
4350.
That area lined up closely with the 50% Fibonacci retracement of the CPI-driven move shown on my 15-minute chart.
The Sequence Was More Important Than the First Candle
Think about what happened:
- Inflation data initially pressured gold.
- Gold dropped sharply.
- The selling failed to continue.
- Buyers reversed the entire move.
- Price attacked the psychological 4400 level.
- The market then retraced approximately half of the impulse.
- Friday ended near the 4350 region.
A trader who blindly sold the first CPI reaction could have been caught in the reversal.
A trader who blindly bought the spike could have been caught in the retracement.
This is exactly why FOMC deserves patience.
XAU/USD Key Levels I Am Watching
| Gold Level | Why It Matters This Week |
|---|---|
| 4500 | Major psychological upside level if FOMC drives a decisive bullish breakout |
| 4450 | Intermediate psychological resistance above Friday’s range |
| 4400 | Friday CPI spike reached this major psychological handle before reversing |
| 4350 | Current pivot region and approximately the 50% Fibonacci retracement area from Friday’s CPI move |
| 4300 | Major psychological support and close to Friday’s initial CPI downside reaction |
| 4250 | Lower support and upper portion of my preferred FOMC AOI |
| 4200 | Major psychological level and lower portion of the ascending-support AOI |
These levels are not predictions.
They are decision points.
If price is between two important levels, I am often more interested in waiting than forcing a trade.
Three Gold Scenarios for FOMC Wednesday
Scenario 1: Hawkish Fed — Gold Sells
If the Fed raises rates and communicates that additional tightening remains likely, Treasury yields and the dollar could strengthen.
In that environment, I would watch whether XAU/USD can hold:
4350 → 4300.
A convincing loss of 4300 would put:
4250 → 4200
directly into focus.
That is the scenario that could bring price into the ascending support area I am most interested in examining.
Scenario 2: Hike, But Dovish Guidance — Gold Reverses Higher
The Fed could raise rates but communicate that future decisions remain highly dependent on incoming data.
If markets decide Wednesday’s hike represents sufficient tightening for now, yields could fall after the announcement.
Gold might initially sell on the headline and then reverse—similar to the behaviour we saw around Friday’s CPI reaction.
In that scenario, reclaiming:
4350 and 4400
would put:
4450 and 4500
back into view.
Scenario 3: Surprise Hold
A decision to leave rates unchanged would be a meaningful surprise relative to current market pricing.
The immediate reaction could include:
- lower short-term Treasury yields;
- U.S. dollar weakness;
- and stronger gold.
But even here, context matters.
If the Fed holds only because it intends to hike later, the first reaction may not survive the press conference.
EUR/USD Going Into FOMC
EUR/USD enters the week near 1.1600.
Friday’s U.S. CPI initially supported the dollar, and EUR/USD was around 1.1595 later in the session.
The euro side of the equation is also important because the European Central Bank just raised its own three key rates by 25 basis points.
The ECB’s deposit facility rate will move to:
2.50%
effective September 16—the same day as the Federal Reserve decision.
So EUR/USD is entering Wednesday with both central banks tightening monetary policy.
That makes the relative outlook more important than either rate decision viewed in isolation.
EUR/USD trades the difference between two policy paths
A Fed hike does not automatically mean EUR/USD must fall if the ECB is also tightening and markets conclude the Fed is near the end of its move. The pair responds to changing expectations for both sides of the exchange rate.
EUR/USD Key Levels for the Week
Without forcing false precision onto a chart that was not supplied with this article, I would use the nearest major round-number and half-figure zones as my initial EUR/USD framework:
| EUR/USD Level | What I Am Watching |
|---|---|
| 1.1700 | Major upside psychological level if dollar weakness develops after FOMC |
| 1.1650 | Intermediate resistance and an area to monitor after a sustained break above 1.1600 |
| 1.1600 | Immediate psychological pivot with EUR/USD finishing Friday near this region |
| 1.1550 | First lower half-figure zone if Fed expectations support the dollar |
| 1.1500 | Major psychological support if Wednesday produces a larger USD move |
These are watch zones rather than precise technical support and resistance derived from a supplied EUR/USD chart.
I would refine them with the actual week’s price action before Wednesday.
EUR/USD Hawkish Fed Scenario
If the Fed delivers a hike and a clearly hawkish forward path:
- 1.1600 may become resistance;
- 1.1550 becomes the next downside area;
- a stronger dollar move could expose 1.1500.
EUR/USD Dovish-Reaction Scenario
If the Fed hikes but markets interpret the communication as less hawkish than expected:
- a reclaim of 1.1600 becomes important;
- 1.1650 becomes the next test;
- 1.1700 becomes relevant if dollar weakness broadens.
Do Not Watch Gold and EUR/USD Alone — Watch Treasury Yields
One of the most important screens this week may not be a currency pair at all.
Watch U.S. Treasury yields.
The benchmark 10-year Treasury yield briefly approached 5% after Friday’s CPI release before pulling back.
Shorter-term yields have also risen as traders increased expectations for Fed tightening.
Why does that matter?
Higher yields can:
- support the U.S. dollar;
- increase the opportunity cost of holding non-yielding gold;
- pressure rate-sensitive equities;
- tighten overall financial conditions.
If Wednesday produces:
higher yields + stronger USD
that would generally create a more difficult backdrop for gold and EUR/USD.
If we get:
falling yields + weaker USD
gold and EUR/USD may find stronger support.
What I Want to See Before Wednesday’s FOMC
Monday and Tuesday matter.
I do not want to view them as meaningless days simply because FOMC is Wednesday.
They tell us where the market is positioning before the announcement.
For Gold
I want to see how XAU/USD behaves around:
- 4350;
- 4400;
- and 4300.
If price repeatedly rejects 4400, that tells us something.
If 4350 establishes itself as support, that tells us something different.
If gold begins losing 4300 before the Fed, my deeper 4250–4200 AOI becomes increasingly relevant.
For EUR/USD
1.1600 is the immediate reference.
I want to see whether the market:
- accepts above it;
- rejects it;
- or simply compresses around it while waiting for Wednesday.
For Yields
The 10-year yield’s behaviour around 5% is important.
A sustained break above that area would send a different macro signal than a sharp rejection lower.
How I Approach the FOMC Announcement
FOMC is not a normal trading environment.
Liquidity can shift quickly.
Spreads can widen.
Orders can experience slippage.
Price can move through several technical levels before reversing.
That makes risk management more important than trying to capture every tick.
A sensible FOMC framework includes:
- reducing unnecessary exposure before 2:00 p.m.;
- knowing your maximum acceptable loss;
- not chasing the first large candle;
- waiting for price to reach a level you identified beforehand;
- watching yields and the dollar alongside the instrument you trade;
- and being willing to do nothing if price action is chaotic.
Sometimes the best FOMC trade occurs:
after the first reaction fails.
What to Watch After the Fed Decision
The work does not end at 3:00 p.m. Wednesday.
In many cases, Thursday provides a cleaner picture of what institutional markets actually concluded.
1. Did Gold Hold the Initial FOMC Move?
If gold rallies Wednesday but gives everything back Thursday, the breakout deserves less confidence.
If gold sells aggressively and then reclaims the broken level, that can be equally informative.
2. Where Do Treasury Yields Close?
A temporary intraday yield spike is different from a sustained repricing of the rate curve.
3. Does EUR/USD Confirm the Dollar Move?
If the dollar is supposedly having a major bullish repricing but EUR/USD refuses to break support, that divergence deserves attention.
4. What Happens to the Fed’s Next-Meeting Probabilities?
Markets will immediately begin repricing October and December.
The question changes from:
“Will the Fed hike in September?”
to:
“What comes next?”
5. Does Price Respect the Levels We Mapped on Sunday?
This is where preparation becomes measurable.
I want to review:
- which levels mattered;
- which levels failed;
- how price behaved when alerts triggered;
- and whether my planned scenarios matched the actual market response.
That review becomes information for the next trading week.
Learn to Build a Trading Plan Before the Market Starts Moving
FOMC week demonstrates why disciplined trading begins before an entry is placed: identify the macro catalyst, map the levels that matter, define the risk and then wait for price to confirm the opportunity. Academy of Financial Markets provides live one-on-one trading education in Toronto for students who want to develop a structured process for combining technical analysis, macro events and risk management.
 LIVE TRADING EDUCATION · TORONTO
My Sunday Weekly Preparation Checklist
Before Markets Become Active
- Review the complete economic calendar.
- Mark all central-bank decisions.
- Mark CPI, PPI, employment and major inflation releases.
- Identify which sessions each event affects.
- Review the previous week’s daily and weekly closes.
- Mark major psychological levels.
- Mark higher-timeframe support and resistance.
- Identify trendlines and areas where multiple levels converge.
- Set price alerts at important levels.
- Review open positions and determine whether they should remain open through major events.
- Know exactly when the FOMC statement is released.
- Know when the press conference begins.
- Check current rate expectations rather than relying on last week’s assumptions.
- Monitor Treasury yields.
- Monitor the U.S. Dollar Index.
- Identify the bullish scenario.
- Identify the bearish scenario.
- Identify the scenario where doing nothing is the correct decision.
- Determine maximum risk before entering any position.
- Plan what evidence would invalidate the trade idea.
My XAU/USD Plan in One View
| Zone | My Current View |
|---|---|
| 4500 | Major upside psychological objective if FOMC produces a sustained bullish breakout |
| 4450 | Intermediate resistance above Friday’s CPI range |
| 4400 | Important psychological resistance; Friday’s CPI reversal reached this area |
| 4350 | Immediate pivot and Friday’s approximate 50% retracement / closing area |
| 4300 | Key psychological support and CPI downside reaction region |
| 4250 | Upper portion of my preferred deeper FOMC area of interest |
| 4200 | Major psychological support near the broader ascending daily support structure |
Final Outlook for FOMC Week
This is exactly the type of week where preparation can matter more than prediction.
Markets enter Wednesday with a significant amount already priced in.
Inflation remains above the Federal Reserve’s target.
August CPI accelerated.
Energy prices remain elevated.
Bond yields are close to multi-year highs.
The Fed already had three policymakers favouring tighter policy at the previous meeting.
And futures markets are now heavily leaning toward a September rate hike.
None of that guarantees a particular market reaction.
In fact, the stronger the consensus becomes, the more important the difference between expectation and reality becomes.
For XAU/USD, my chart gives me a clear framework.
Friday’s CPI reaction showed how quickly gold can:
sell off → reverse → attack 4400 → retrace to 4350.
Going into FOMC, I am watching that same sequence of psychological levels.
The deeper setup I would particularly like to see is a move into the:
4250–4200 ascending-support area.
If FOMC produces that move and the market begins showing evidence of support, that becomes an area I want to investigate.
If it never gets there, I do not need to force the idea.
That is the entire point of planning.
We identify what would interest us.
We set alerts.
We let the market come to us.
And when a major event such as the Federal Reserve creates volatility, we already know which prices deserve our attention.
For more preparation resources, visit our Market Hours, Risk Management and Forex Education sections. Traders following Canadian and U.S. macro developments can also explore our Canada coverage and Market Insights.