
Far fewer understand what their journal should actually measure.
Recording an entry price, exit price and profit or loss is useful, but it does not necessarily reveal whether a trading strategy has a measurable advantage.
A trader can finish a week with a positive account balance while repeatedly violating their trading plan.
Another trader can finish the same week with a loss despite executing every position according to a strategy with positive historical expectancy.
These outcomes cannot be evaluated properly using profit and loss alone.
A professional trading journal should help answer a more important question:
Is my trading process producing results that are consistent with a repeatable, measurable strategy?
To answer that question, traders need to examine more than their winning percentage.
They need to understand expectancy, average winning and losing trades, risk-to-reward, drawdown, execution quality, market conditions and the difference between following a strategy and simply getting a favourable outcome.
The central principle: A trading journal should measure the quality of the trading process, not simply record the financial outcome. The objective is to identify which strategies, conditions and execution decisions are associated with repeatable performance.
What Is a Forex Trading Journal?
A forex trading journal is a structured record of trading decisions, market conditions, execution and results.
It allows traders to review historical performance and identify patterns that may not be obvious while actively trading.
A useful journal should document:
- the trading instrument;
- the strategy being used;
- the reason for entering;
- the market conditions at entry;
- the planned risk;
- the actual execution;
- the resulting profit or loss;
- and whether the trade followed the original trading plan.
Over time, this information can be used to calculate performance statistics and evaluate whether a strategy is producing the outcomes originally expected.
The journal can take several forms.
Some traders use spreadsheets.
Others use dedicated trade-analysis platforms.
Automated traders may collect information directly from their trading terminals, databases or Expert Advisors.
The format matters less than the quality and consistency of the information recorded.
Why a Trading Journal Matters
Without systematic recordkeeping, traders often evaluate their performance using recent experience rather than a representative sample of trades.
For example, a trader may conclude that their strategy performs well because they recently experienced several profitable sessions.
But a broader review could reveal that the strategy performed poorly during the previous three months.
Another trader may abandon a strategy after four consecutive losses even though similar losing streaks occurred regularly during its historical testing period.
A journal allows performance to be evaluated using recorded evidence rather than relying entirely on memory.
Separate Strategy Performance From Execution Performance
This distinction is particularly important.
Suppose a strategy generates ten valid trading opportunities.
The trader follows the rules on six trades but enters early, increases position size or moves the stop loss on the remaining four.
The final account result reflects both the strategy and the trader’s deviations from that strategy.
Without recording those deviations, it becomes difficult to determine whether disappointing performance resulted from:
- the strategy itself;
- poor execution;
- inappropriate position sizing;
- changing market conditions;
- or some combination of those factors.
A useful distinction: A profitable trade is not automatically a well-executed trade, and a losing trade is not automatically evidence of a poor decision. Performance analysis should distinguish between the validity of the setup, the quality of execution and the final financial outcome.
What Every Forex Trader Should Record
Before calculating performance statistics, traders need a consistent set of data.
At a minimum, each trade should include the following information.
| Data Field | Purpose |
|---|---|
| Trade Date and Time | Identify trading sessions and time-based patterns. |
| Instrument | Separate results by currency pair, gold or another market. |
| Strategy | Measure different setups independently. |
| Direction | Distinguish long and short performance. |
| Entry and Exit Prices | Document execution and realized price movement. |
| Initial Stop Loss | Establish the original planned risk. |
| Position Size | Measure exposure and position-sizing consistency. |
| Planned Monetary Risk | Calculate realized performance relative to initial risk. |
| Net Profit or Loss | Measure actual financial performance after costs. |
| Market Conditions | Identify trend, range, volatility and news-related behaviour. |
| Plan Followed? | Distinguish strategy performance from execution deviations. |
More advanced journals can include additional information such as volatility, economic calendar events, correlation, maximum adverse excursion and maximum favourable excursion.
However, the objective is not to record hundreds of variables simply because the spreadsheet allows it.
The objective is to record information that can lead to meaningful analysis.
Understanding R-Multiples: A Better Way to Compare Trades
One of the most useful measurements in a trading journal is the R-multiple.
An R-multiple expresses the outcome of a trade relative to its original planned monetary risk.
Suppose a trader opens a position with a maximum planned loss of:
$100.
For this trade:
1R = $100.
If the trade closes with a $200 profit:
Result = +2R.
If the trade closes with a $50 loss:
Result = -0.5R.
If the trade loses the entire original risk amount:
Result = -1R.
The R-Multiple Formula
Why R-Multiples Matter
Imagine comparing a $500 profit on a $100,000 account with a $100 profit on a $5,000 account.
The dollar amounts alone do not reveal which trade produced a larger return relative to the risk taken.
Using R-multiples allows traders to compare results across:
- different account sizes;
- different currency pairs;
- different position sizes;
- and different trading strategies.
For example, a +2R result has the same relationship to initial planned risk regardless of whether the trade generated $20, $200 or $2,000 in profit.
Important: Calculate R using the original planned monetary risk rather than changing the denominator after moving a stop loss or increasing position size. Otherwise, the journal can misrepresent the trade’s original risk and execution quality.
How to Calculate Trading Expectancy
Trading expectancy measures the average expected result of a trading process based on its distribution of winning and losing outcomes.
For a simplified two-outcome model, expectancy can be calculated using:
- the probability of a winning trade;
- the average winning trade;
- the probability of a losing trade;
- and the average losing trade.
The Trading Expectancy Formula
In this formula, average loss is expressed as a positive magnitude.
Breakeven outcomes can be included separately or handled by using the actual average result of all trades.
Example: A Strategy With a 40% Win Rate
Suppose a strategy produces:
40% winning trades.
The average winner is:
+2R.
The average loser is:
-1R.
The remaining 60% of trades are losses.
Expectancy becomes:
(0.40 × 2R) − (0.60 × 1R)
= +0.20R per trade.
Based on these assumed outcome frequencies and average results, the strategy has positive arithmetic expectancy before any costs not already included in the R results.
The trader loses more often than they win.
However, the average winning trade is large enough to outweigh the average losing trade.
This illustrates why win rate alone is not a sufficient measure of strategy quality.
Expectancy Does Not Guarantee Future Profitability
Historical expectancy is an estimate derived from observed results.
It does not guarantee that future trades will have the same outcome distribution.
Market conditions change, execution costs vary and trading strategies may perform differently over time.
Small samples can also produce highly unstable expectancy estimates.
For that reason, expectancy should be evaluated alongside sample size, drawdown, market conditions and out-of-sample performance.
Why a High Win Rate Does Not Automatically Mean a Profitable Strategy
Win rate measures the percentage of trades that close profitably.
It does not measure how much money is won or lost.
Consider two hypothetical strategies.
| Metric | Strategy A | Strategy B |
|---|---|---|
| Win Rate | 80% | 40% |
| Average Winner | +0.25R | +2R |
| Average Loser | -1R | -1R |
| Expectancy | 0R | +0.20R |
Strategy A wins 80% of the time, yet its hypothetical expectancy is zero before any additional trading costs.
Strategy B wins only 40% of the time but has positive expectancy under the stated assumptions.
This does not mean lower win-rate strategies are universally preferable.
It means that the relationship between winning frequency and average outcome is what determines arithmetic expectancy.
Actual strategy evaluation also requires considering trading costs, position sizing, drawdown and the uncertainty of the underlying estimates.
Understanding Profit Factor
Profit factor is another commonly used trading-performance statistic.
It compares total gross trading profit with the absolute value of total gross trading losses.
Example
Suppose a strategy generates:
$12,000 in gross winning trades.
Its losing trades total:
$8,000.
The profit factor is:
12,000 ÷ 8,000 = 1.50.
For every dollar lost on losing trades, the strategy generated $1.50 in gross winning-trade profits during the observed period.
Profit factor is useful, but it has limitations.
A strategy may display a high profit factor because of one unusually large winning trade.
Another strategy may produce a respectable profit factor while experiencing substantial drawdown or long periods without profitability.
Profit factor should therefore be considered alongside expectancy, sample size, drawdown and the distribution of individual trade outcomes.
Measuring Trading Drawdown
Drawdown measures the reduction in account value from a previous high.
It is one of the most important statistics for understanding the risk associated with a trading strategy.
Suppose an account grows from:
$10,000 to $12,000.
The account then declines to:
$10,800.
The reduction from the previous peak is:
$1,200.
The percentage drawdown is:
10%.
Why Drawdown Matters
Two strategies can generate similar total returns while exposing traders to very different levels of account fluctuation.
For example, one strategy may generate a 15% return while experiencing a 5% maximum drawdown.
Another strategy may generate the same return while experiencing a 35% maximum drawdown.
The total return is identical.
The observed path of account equity is very different.
Drawdown analysis can help traders evaluate whether a strategy’s risk profile is compatible with their financial circumstances and account restrictions.
Balance Drawdown vs Equity Drawdown
A trading journal should distinguish between drawdown calculated using closed account balances and drawdown calculated using floating equity.
A strategy that allows positions to move deeply into floating losses before recovering may display modest balance drawdown while experiencing substantial equity drawdown.
For traders using grid strategies, basket trading or multiple simultaneous positions, this distinction is particularly important.
Read our guide to daily, static and trailing drawdown for additional information about how drawdown calculations affect funded accounts.
Maximum Adverse Excursion and Maximum Favourable Excursion
Two advanced metrics can provide useful information about what happens while a position remains open.
They are:
Maximum Adverse Excursion (MAE)
and:
Maximum Favourable Excursion (MFE).
Maximum Adverse Excursion
MAE measures the largest unrealized movement against a trade during its lifetime.
Suppose a long position eventually closes with a $200 profit.
Before reaching that outcome, the position experienced a maximum floating loss of:
$75.
Its observed MAE was $75.
When recorded across many trades, MAE can help identify how far positions typically move against the trader before reaching their final outcome.
Maximum Favourable Excursion
MFE measures the largest unrealized movement in favour of a trade during its lifetime.
Suppose a position reaches:
+$350 floating profit.
The trader eventually closes it at:
+$150.
The trade’s MFE was $350.
Its realized result was $150.
What MAE and MFE Can Reveal
Over a sufficiently broad sample, these measurements may help evaluate:
- stop-loss placement;
- profit-taking behaviour;
- whether profitable trades regularly experience substantial adverse movement;
- whether positions frequently surrender large portions of floating profit;
- and whether existing exit rules are consistent with the observed strategy behaviour.
Important: MAE and MFE should not be used to optimize stop losses or profit targets solely from trades that were already profitable. Doing so can create hindsight bias and overfitting. Any proposed changes should be evaluated across the full strategy sample and tested on independent data.
Analyzing Performance by Trading Session
Forex market conditions change throughout the global trading day.
Liquidity, volatility and the composition of active market participants are not constant.
For traders based in Toronto, it can be particularly useful to separate results by trading session.
Common session categories include:
- Asian session;
- London session;
- London–New York overlap;
- New York morning;
- and late New York session.
Example
Suppose a trader records 100 trades using one defined strategy.
After reviewing the data, the trader observes that the strategy has produced different average outcomes during the London session and the New York afternoon.
That observation may justify investigating whether the strategy behaves differently under changing liquidity and volatility conditions.
However, the trader should not immediately conclude that one session is inherently profitable and the other is not.
Differences may result from sample size, changing market conditions, execution costs or other variables.
What I Would Track
For each trading session, record:
- number of trades;
- win rate;
- average winner;
- average loser;
- expectancy in R;
- net profit or loss;
- maximum drawdown;
- and the percentage of trades that followed the plan.
For additional context, read our guide to forex market hours in Toronto.
Measuring Performance Under Different Market Conditions
A strategy may behave differently in trending, ranging and highly volatile markets.
For example, a trend-following strategy may generate its largest profits during sustained directional movements.
The same approach may produce repeated losses during consolidation.
A range-trading strategy may experience the opposite pattern.
A useful trading journal should therefore record the market environment in which each trade occurs.
Possible Market Categories
- established uptrend;
- established downtrend;
- consolidation or range;
- breakout;
- retracement;
- high-volatility economic event;
- and unusually low-liquidity conditions.
These classifications should be defined consistently before reviewing the outcome of the trade.
Otherwise, traders may unconsciously label profitable trades as occurring under favourable conditions and losing trades as occurring under unfavourable conditions.
That introduces hindsight bias into the analysis.
Measuring Execution Quality
A strategy’s theoretical performance can differ from its actual live performance because of execution costs and trading decisions.
Useful execution metrics include:
- requested entry price;
- actual entry price;
- requested exit price;
- actual exit price;
- spread at entry;
- commission;
- slippage;
- and whether the trade followed the intended order-management rules.
Why Execution Matters
Suppose a strategy targets an average profit of five pips per trade.
An additional pip of execution cost represents a meaningful proportion of that target.
For another strategy targeting several hundred pips over a multi-day holding period, the same additional pip may be less significant.
Execution analysis should therefore consider the strategy’s expected trade size, holding period and average result.
For a broader explanation of broker pricing and execution, read our guide to forex broker spreads, commissions, slippage and execution quality.
Tracking Trading Psychology Without Turning the Journal Into a Diary
Trading psychology is relevant because emotions can affect execution, position sizing and adherence to a trading plan.
However, simply writing that a trader felt confident, nervous or frustrated does not provide much analytical value on its own.
The more useful question is whether a particular state was associated with a measurable change in trading behaviour.
Example
A trader experiences three consecutive losses.
On the next position, they double their usual lot size.
The trade happens to close profitably.
A simple profit-and-loss journal records another winning trade.
A process-oriented journal records:
- the previous losing streak;
- the increase in position size;
- the violation of the normal risk budget;
- and the final profitable outcome.
The trader can then review whether similar deviations occur repeatedly after losses.
Useful Behavioural Fields
Consider including:
- Was the trade part of the original plan?
- Was position size calculated correctly?
- Was the stop loss moved outside the permitted rules?
- Was the trade opened to recover a previous loss?
- Was the trade entered before confirmation?
- Was the economic calendar reviewed?
- Did the trader stop after reaching the daily loss limit?
These questions convert subjective experience into information that can be reviewed systematically.
A Practical Forex Trading Journal Template
The following template illustrates how a trader might organize information for each completed position.
It can be adapted to Excel, Google Sheets, a dedicated trading journal or a custom dashboard.
| Journal Field | Illustrative Entry |
|---|---|
| Instrument | EUR/USD |
| Trading Session | New York Morning |
| Strategy | Higher-Timeframe Trend Continuation |
| Direction | Long |
| Entry Price | 1.17000 |
| Initial Stop Loss | 1.16800 |
| Planned Risk | $100 |
| Exit Price | 1.17400 |
| Illustrative Net Result | +$200 |
| Result in R | +2R |
| Plan Followed? | Yes |
| Trading Notes | Daily bullish structure, one-hour pullback, 15-minute confirmation. |
All values in this example are hypothetical.
The objective is to illustrate the information a trader can record, not to suggest that the example represents an actual historical trade.
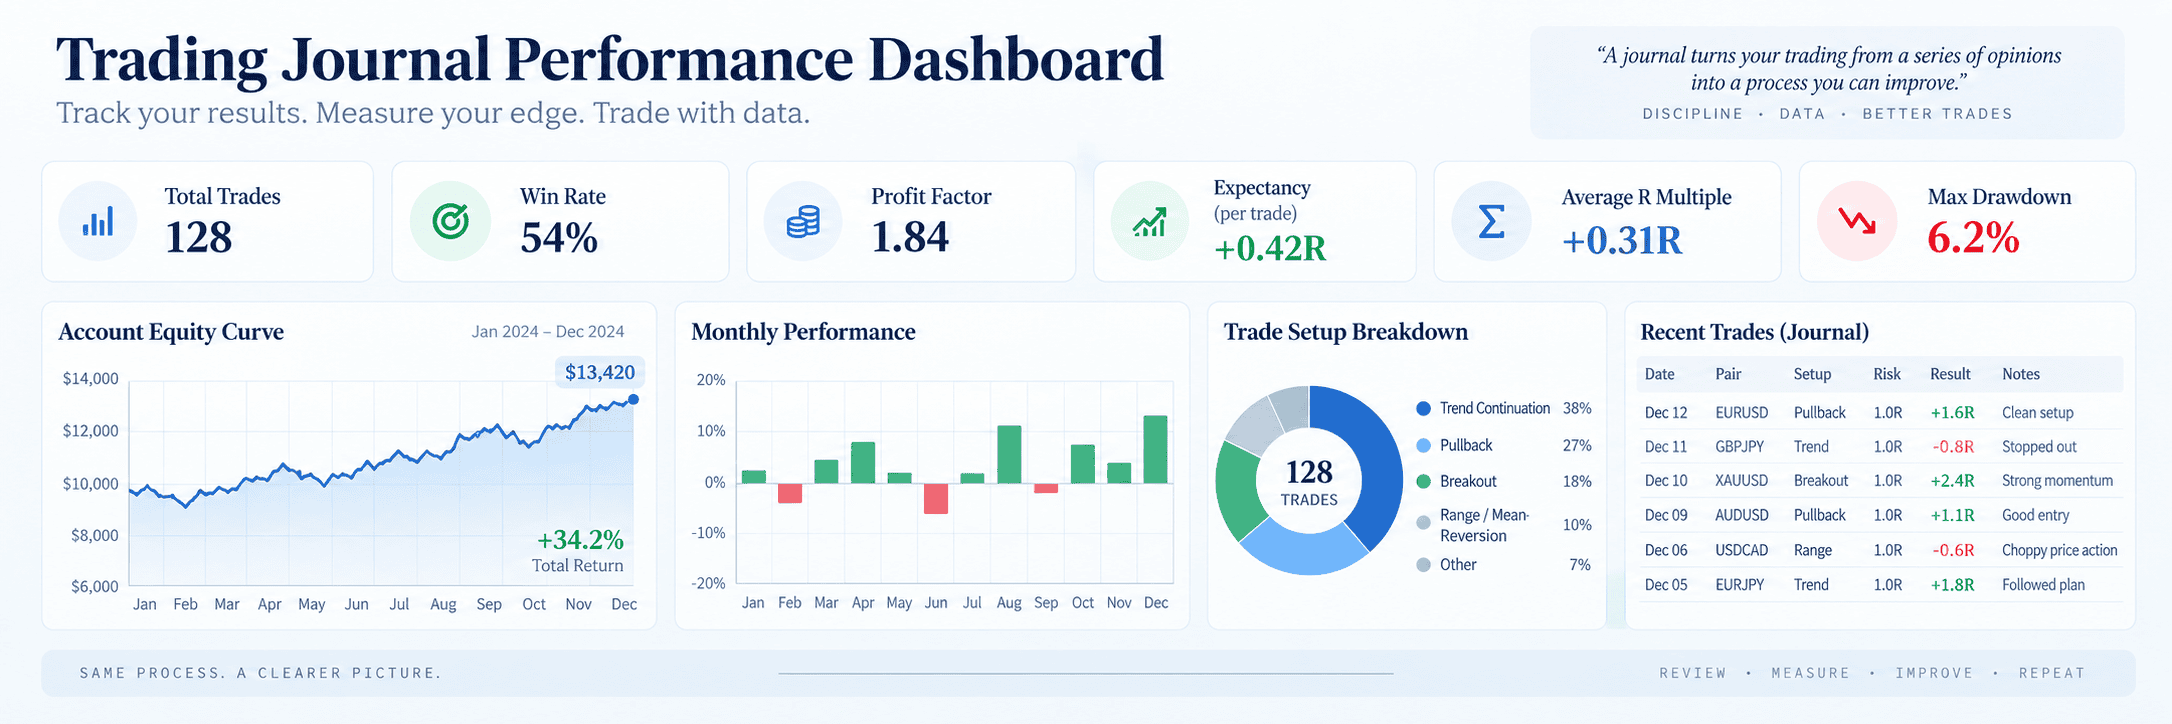
Example Trading Performance Dashboard
A visual performance report can make trading statistics easier to interpret.
Rather than focusing exclusively on the account’s final profit or loss, a useful dashboard can display:
- total completed trades;
- winning and losing trades;
- average result in R;
- profit factor;
- maximum balance and equity drawdown;
- performance by instrument;
- and the equity curve over time.
How to Conduct a Weekly Trading Review
A trading journal becomes useful when the recorded information is reviewed consistently.
One practical approach is to conduct a structured review after the trading week has finished.
For Toronto-based forex traders, that may mean reviewing performance after the Friday market close and preparing the next week’s trading plan before markets reopen.
Step 1 — Reconcile the Trading Records
- Confirm that every completed trade has been recorded.
- Include commissions, financing and other relevant costs.
- Verify actual position sizes and monetary results.
- Separate trading results from deposits and withdrawals.
Step 2 — Review Strategy Performance
- Calculate the number of trades.
- Calculate the win rate.
- Measure average winning and losing trades.
- Calculate expectancy in R.
- Review profit factor and drawdown.
Step 3 — Review Execution Quality
- Identify trades that violated the original plan.
- Review position-sizing errors.
- Document early entries and premature exits.
- Review execution during major economic releases.
Step 4 — Review Market Conditions
- Compare performance across instruments.
- Review trading-session results.
- Identify relevant market regimes.
- Consider whether scheduled economic events affected execution.
Step 5 — Prepare the Following Week
- Review upcoming economic announcements.
- Identify major technical areas of interest.
- Confirm account-level risk limits.
- Document any strategy changes that require testing.
- Set measurable process objectives for the next week.
Do Not Rewrite the Strategy After Every Losing Week
One of the dangers of frequent performance reviews is overreacting to short-term results.
A strategy can experience a losing week without its underlying expectancy having changed.
Likewise, a profitable week does not prove that the strategy has a sustainable advantage.
Changes should be based on a sufficiently broad body of evidence rather than the most recent outcome alone.
When Is a Trading Strategy Statistically Reliable?
There is no universal number of trades that guarantees a reliable estimate of trading expectancy.
The required sample size depends on several factors, including:
- the variability of individual trade outcomes;
- the size of the potential trading advantage;
- the frequency of rare but substantial losses;
- the similarity of market conditions across the sample;
- and whether observations are sufficiently independent.
A strategy with highly variable outcomes may require substantially more observations than a strategy with relatively stable trade results.
Why Small Samples Can Be Misleading
Suppose a trader completes ten trades.
Eight are profitable.
The observed win rate is:
80%.
That does not establish that the strategy has an underlying 80% probability of winning future trades.
The observed result could differ substantially from the strategy’s longer-run characteristics.
Increasing the sample size can reduce some forms of estimation uncertainty, but it does not eliminate changes in market conditions or model risk.
Out-of-Sample Testing
A useful approach is to develop a strategy using one dataset and evaluate it using separate observations that were not used to choose or optimize the rules.
This is known as out-of-sample testing.
For example:
- use an initial historical period to develop the strategy;
- evaluate the fixed rules on a separate historical period;
- then monitor how the strategy behaves during subsequent demo or live trading.
The purpose is to reduce the risk of mistaking a strategy that was tailored to historical data for one that has a repeatable advantage.
Even successful out-of-sample testing does not guarantee future profitability.
Keep Strategy Versions Separate
If a trader changes entry criteria, exit rules, position sizing or session restrictions, those changes should be documented.
Otherwise, the journal may combine results from several materially different strategies and present them as one continuous performance history.
A simple strategy-version field can help prevent that problem.
Practicing Your Trading Strategy Before Committing Live Capital
A demo account can provide a useful environment for developing the mechanics of a trading journal.
Traders can practice recording:
- trade entries and exits;
- planned and realized risk;
- strategy classifications;
- market-session information;
- and execution-quality observations.
Demo results should not be treated as a guarantee of live trading performance.
Live markets introduce financial consequences, potential differences in execution and other factors that may affect outcomes.
Practice Your Strategy on a Demo Account
Explore OX Securities’ trading platform and use a demo account to practice execution, position sizing and journal-based performance analysis before deciding whether live trading is appropriate.
Common Forex Trading Journal Mistakes
1. Recording Only Winning and Losing Trades
Profit and loss alone does not reveal whether the strategy or the execution process is responsible for the result.
2. Focusing Entirely on Win Rate
Win rate must be evaluated alongside average winning and losing trades, costs and the distribution of outcomes.
3. Mixing Different Strategies
Combining unrelated trading approaches can obscure the performance characteristics of each individual strategy.
4. Ignoring Floating Drawdown
A strategy can finish with positive closed profit while exposing the account to substantial unrealized losses during the trading process.
5. Changing Risk Between Trades Without Recording It
Position-sizing changes can materially affect account performance and should be documented.
6. Reviewing Only Recent Trades
Short-term outcomes can differ substantially from longer-run strategy characteristics.
7. Optimizing Rules From the Same Data Used to Evaluate Them
Repeatedly adjusting a strategy to improve historical statistics can create an overfitted system that performs poorly on new data.
8. Treating One Large Winner as Proof of a Trading Edge
A strategy may display positive total profit because of one exceptional outcome while the remaining trades have negative expectancy.
9. Ignoring Transaction Costs
Spreads, commissions, swaps and slippage can materially change the results of strategies with small average trade profits.
10. Failing to Act on the Information
A trading journal is not useful merely because it contains a large amount of data.
Its value comes from using that data to evaluate decisions, test proposed changes and maintain an objective trading process.
Frequently Asked Questions
What is a forex trading journal?
A forex trading journal is a structured record of trading decisions, execution, market conditions and outcomes. It allows traders to evaluate strategy performance and identify patterns in their trading process.
What should I record in my trading journal?
Record the instrument, date, trading session, strategy, direction, entry, exit, original stop loss, position size, planned risk, actual profit or loss, market conditions and whether the trade followed the original plan.
What is trading expectancy?
Trading expectancy measures the average expected outcome of a trading process based on its distribution of winning and losing results. It can be expressed in dollars, account currency or R-multiples.
Can a strategy be profitable with a 40% win rate?
Yes. A strategy with a relatively low win rate can have positive expectancy if its average winning trade is sufficiently larger than its average losing trade.
Is an 80% win rate automatically good?
No. A strategy can win frequently yet lose money overall if its average losing trades are substantially larger than its average winning trades.
What does R mean in trading?
R represents the original planned monetary risk on a trade. A +2R result means the trade generated a profit equivalent to twice its original planned risk.
What is profit factor?
Profit factor is the ratio of total gross trading profit to the absolute value of total gross trading losses over a defined period.
What is maximum drawdown?
Maximum drawdown is the largest observed decline in account value from a previous peak over the measurement period, using a specified balance or equity calculation.
What is maximum adverse excursion?
Maximum adverse excursion measures the largest unrealized movement against a trade during its lifetime.
What is maximum favourable excursion?
Maximum favourable excursion measures the largest unrealized movement in favour of a trade while the position remains open.
How many trades do I need before calculating expectancy?
Expectancy can be calculated from any completed sample, but the reliability of the estimate depends on the sample size, variability of outcomes and underlying market conditions. No fixed trade count guarantees statistical reliability.
Can I use MT5 to build a trading journal?
Yes. MT5 provides trading history and account information that can be used as a starting point. A more comprehensive journal may require additional information about strategy classification, planned risk, market conditions and adherence to trading rules.
Should I review my journal every day or every week?
Recording trades promptly helps preserve accurate information. Daily reviews can identify immediate execution issues, while weekly and monthly reviews can provide a broader perspective on strategy performance.
Final Perspective
A trading journal should do more than tell you whether you made or lost money.
It should help you understand how those results were produced.
That requires a disciplined approach to measuring:
- trade frequency;
- win rate;
- average winning and losing trades;
- expectancy;
- profit factor;
- drawdown;
- execution quality;
- and strategy performance across different market conditions.
It also requires separating strategy performance from deviations in the trader’s execution.
A profitable trade taken outside the trading plan should not automatically be classified as evidence that the strategy works.
A losing trade executed according to a valid strategy should not automatically be treated as a failure of the trading process.
Over time, a structured trading journal can provide the information needed to evaluate whether a strategy is behaving as expected, whether risk remains controlled and whether proposed changes are supported by evidence.
That is the objective.
Not simply to record trades, but to understand the process that produces the results.
Continue exploring our Education, Risk Management, Toronto Forex, Insights and Market Hours sections for more research.
Affiliate Disclosure: TorontoForex.com may receive compensation from qualifying referrals through the OX Securities partner registration link. This commercial relationship does not guarantee account approval, trading performance, execution quality, profitability or suitability. Readers should independently verify the relevant brokerage entity, regulatory status and account conditions before opening or funding an account.
Educational & Risk Disclaimer: This article is provided for general educational and informational purposes only and does not constitute individualized financial or trading advice. All trading examples, statistics and monetary values are hypothetical unless explicitly identified otherwise. Historical performance, simulated results and statistical estimates do not guarantee future profitability. Market conditions, execution costs and strategy performance can change over time. Forex and CFD trading involve substantial risk, including the potential loss of trading capital.